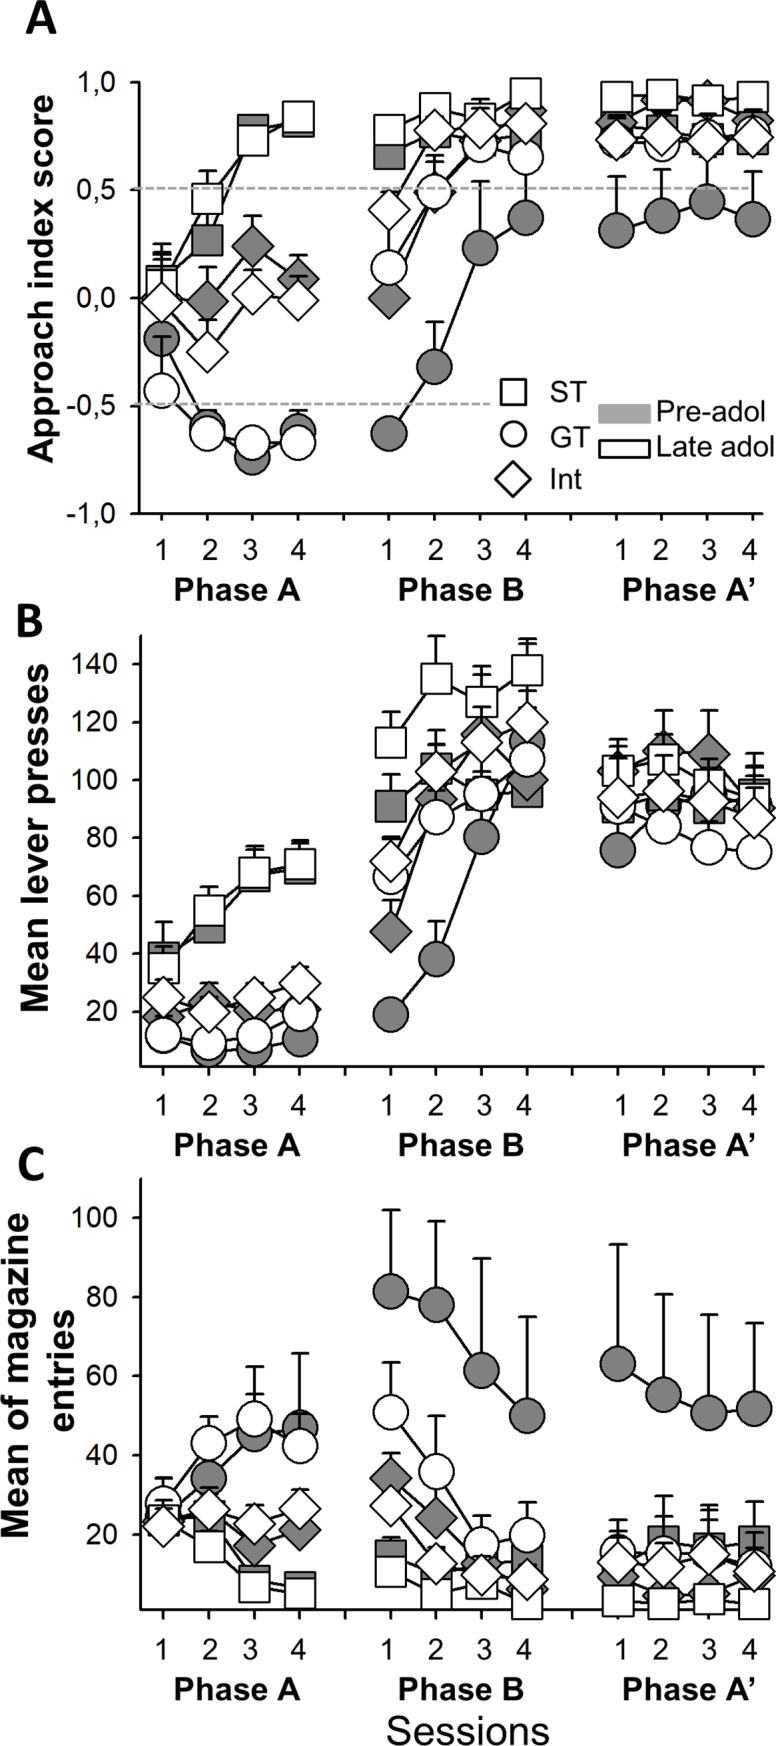
Fig 4.

A. Approach Index Score of pre-adolescent (filled symbols) and Late adolescent (open symbols) groups. The figure includes mean and standard errors from session 1A to 4A, and 1B to 4B and 1A’ to 4A’ for each group. Dotted lines represent the limits among phenotypes. B. Mean of lever-press behavior and magazine entries (C) when CS was presented in ST (filled and open triangles), GT (filled and open circles), and Int (filled and open squares) groups.
