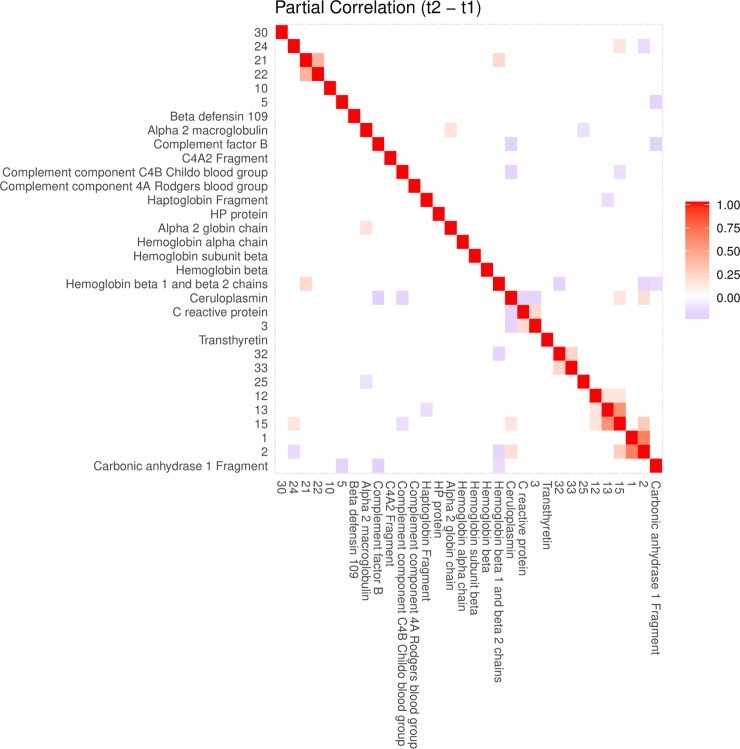
Fig 5. A heatmap of partial correlations between differences in spot intensities from t1 to t2.
Contrary to the heatmap in Fig 3, a heatmap of partial correlations as depicted here is relatively uncluttered. Sparsity was achieved by estimating the support of the inverse covariance matrix through a local false discovery rate of 0.05 as described in the methods section. Row and column order were set by hierarchical clustering using f(x) = 1−pcor(x) as distance function. Heatmaps of partial correlations corresponding to the other time point transitions are included as supplementary figures (S23, S24 and S25 Figs).

