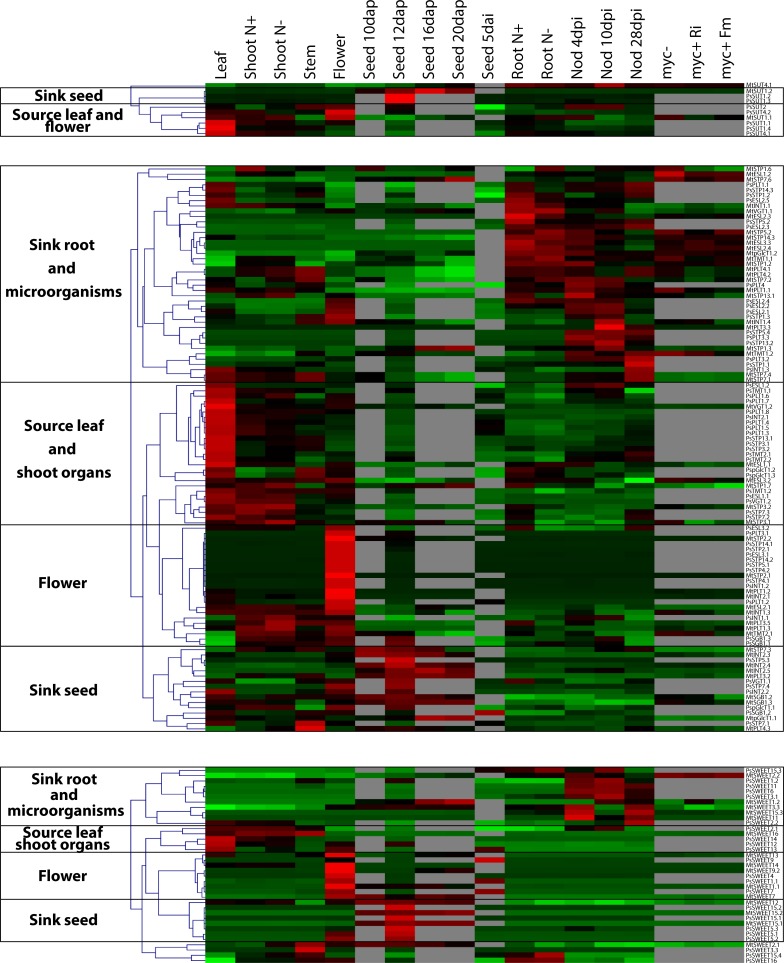
Fig 4. Gene expression patterns of SUT, MST and SWEET.
Transcriptomics profile of Medicago and pea SUT (top panel), MST (middle panel) and SWEET (bottom panel) from plant samples (leaf, shoot, stem, flower, seed and root); shoot and root supplemented with nitrogen (N+) or nitrogen limited (N-); roots inoculated with beneficial microorganisms like Rhizobia (at 4, 10, 28 days post inoculation), arbuscular mycorrhizal fungi (Rhizophagus irregularis: myc+Ri or Funneliformis mosseae: myc+Fm) and non-mycorrhizal root control (myc-). The heat map shows z-score normalized expression for genes/rows (green: low expression, red: high expression) and a hierarchical gene tree, highlighting coexpression clusters.

