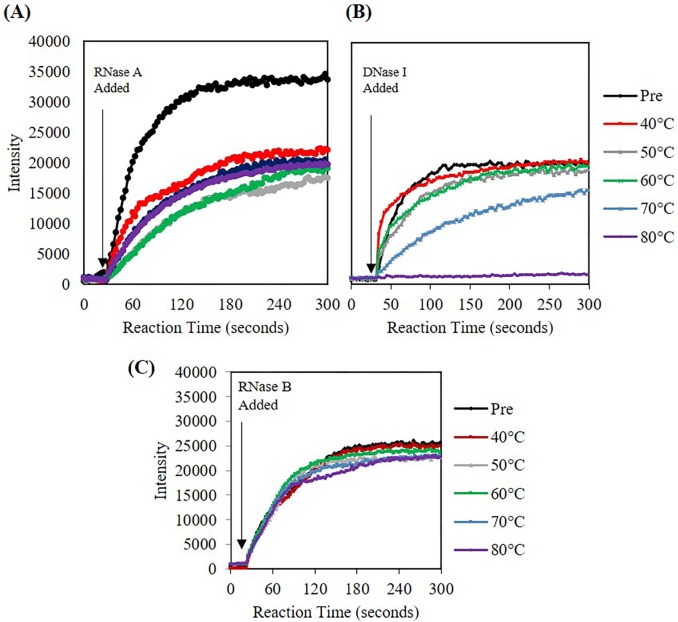
Fig 7. Fluorescent intensity at 520 nm (RNase A) and 556 nm (DNase I) and 520 nm (RNase B) versus time for conventionally heated (1 minute) nucleases.
(A) RNase A (B) DNase I (C) RNase B. For RNase A and DNase I, as temperature increases, the activity of the nucleases decreases. For RNase B, the rate is statistically different at 70°C and 80°C.

