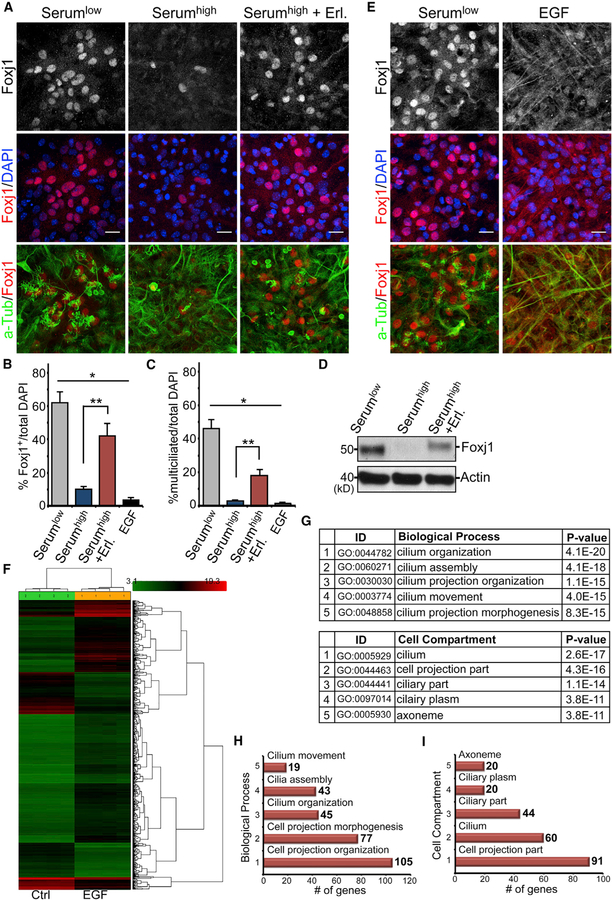
Figure 1. EGF Inhibition of Ependymal Differentiation.
(A) IHC images of EC cultures grown in differentiation media (Serumlow), media containing 10% serum (Serumhigh), or media containing both 10% serum and Erlotinib (Serumhigh + Erl.). Samples were labeled with antibodies to Foxj1, acetylated tubulin (a-Tub), and DAPI. Scale bar: 20 µm.
(B) IHC images of EC cultures grown in differentiation media or differentiation media + EGF (EGF) and labeled with antibodies to Foxj1, a-Tub, and DAPI. Scale bar: 20 µm.
(C) Quantifications of Foxj1+ cells as the percentage of total DAPI-labeled cells. *p < 0.0001, one-way ANOVA; **p < 0.0064, Wilcoxon two-sample test; n = 5; mean ± SEM.
(D) Quantifications of multiciliated cells (visualized by a-Tub staining) as the percentage of total DAPI-labeled cells. *p < 0.0001, one-way ANOVA; **p < 0.0064, Wilcoxon two-sample test; n = 5; mean ± SEM.
(E) Western blot analysis of EC cultures grown in differentiation media (Serumlow), 10% serum (Serumhigh), or 10% serum + Erlotinib (Serumhigh + Erl.). Actin is the loading control.
(F) Transcriptome heatmap, with genes changing at least 2-fold between EGF-treated (EGF) and untreated (Ctrl) cultures. Log2 expression values were row normalized using Z scores and clustered using hierarchical clustering.
(G–I) Enriched GO terms (G) ranked by the percentage of genes located in each library. The number of genes identified for biological process (H) and cell compartment (I) is indicated for each bar graph.
See also Figure S1.

