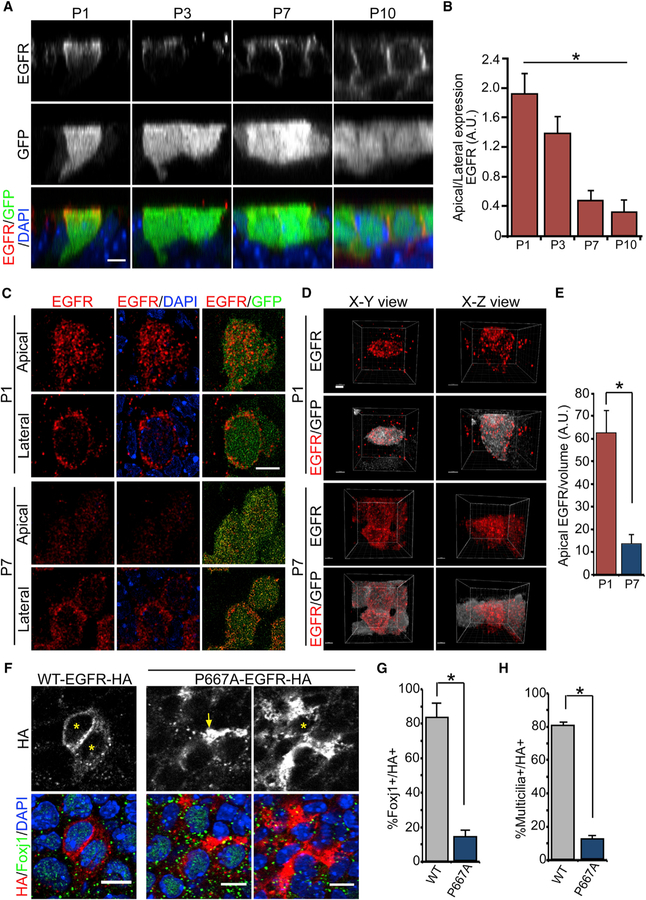
Figure 2. Apical to Basolateral Ependymal EGFR Localization.
(A) IHC images in x-z views of LV whole mounts from FOXJ1-GFP+ animals, with antibodies to EGFR, GFP, and DAPI. Scale bar: 10 µm.
(B) Quantification of the apical/basolateral EGFR expression ratio in FOXJ1-GFP+ pRGPs. *p < 0.0001, one-way ANOVA, n = 10 cells for each group, mean ± SEM.
(C) STED super-resolution images from the P1 and P7 LV surface labeled with EGFR and GFP antibodies. Single apical and lateral optical sections are shown. Scale bar: 5 µm.
(D) 3D rendering of STED super-resolution images from (C), with EGFR in red and GFP in white for clarity. Scale bars: 2 µm.
(E) Quantifications of apical EGFR particles as the fraction of the volume measured. *p < 0.001, Student’s t test, n = 10, mean ± SEM.
(F) IHC images from P14 LV whole mounts injected P1 with either WT-EGFR-HA or P667A-EGFR-HA lentivirus and labeled with anti-Foxj1/HA antibodies and DAPI. The asterisk indicates the cell body of HA+ cells quantified; note apically expressed P667A-EGFR-HA (arrow, left panels) from the deeper section of the same cell in right panels (*). Scale bars: 10 µm.
(G) Quantifications of Foxj1+ cells per total HA+ cells for each construct. *p < 0.0286, Wilcoxon two-sample test, n = 4 animals, mean ± SEM.
(H) Quantifications of multicilia+ cells per total HA+ cells for each construct. *p < 0.0286, Wilcoxon two-sample test, n = 4 animals, mean ± SEM.
See also Figures S2 and S3.

