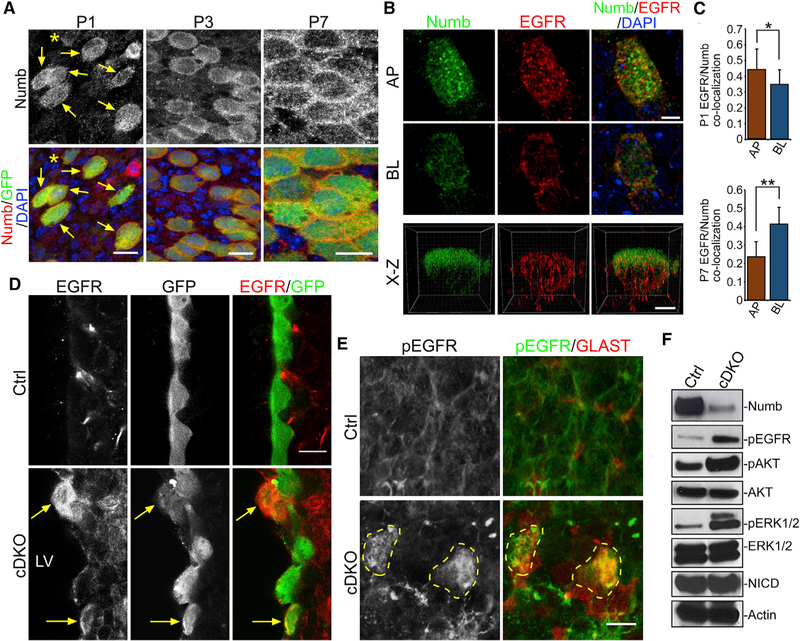
Figure 3. EGFR Activation Defects in Numb/Numblike Mutants.
(A) IHC images of LV whole mounts from FOXJ1-GFP+ mice labeled with antibodies to Numb/GFP and DAPI. At P1, most GFP+ cells strongly expressed Numb (arrows), while GFP-dim cells showed lower Numb levels (*). Scale bar: 10 µm.
(B) STED super-resolution images of LV whole mounts from P1 FOXJ1-GFP+ animals labeled with antibodies to Numb, EGFR, and DAPI. AP, apical domain; BL, basolateral domain. x-z view, optical section from longest x-y axis. Scale bar: 5 µm.
(C) Quantifications of Numb/EGFR co-localization at AP or BL domains from P1 (top graph) or P7 (bottom graph) animals. Co-localization, average Pearson’s coefficient. *p < 0.03, **p < 0.0001, Student’s t test, n = 12 cells, mean ± SEM.
(D) IHC images of LV neurogenic niche coronal sections from P14 control (Ctrl) or FOXJ1-Cre; Nbflox/flox; NblKO/KO; CAG-GFP (cDKO) animals labeled with antibodies to GFP and EGFR. Note the cDKO GFP+ cells with high-level EGFR and AP localization (arrows).
(E) IHC images of LV whole mounts from P14 Ctrl or cDKO animals, labeled with antibodies to pEGFR and GLAST and showing mutant cells strongly expressing pEGFR (dashed circles). Scale bar: 20 µm.
(F) Western blot analysis of LV whole mounts from P14 Ctrl or cDKO animals. Actin is the loading control.
See also Figure S4.

