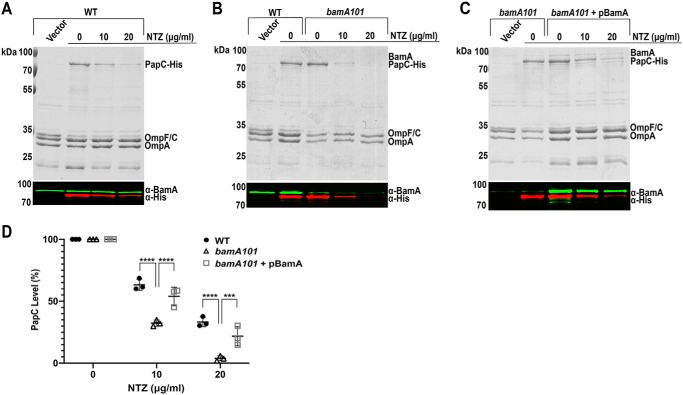
Figure 2.
Effect of Bam underexpression on sensitivity to NTZ. Strains MC4100/pMJ3 (PapCHis) (A), MC4100bamA101/pMJ3 (B), and MC4100bamA101/pMJ3 + pBamA (C) were grown in the presence of the indicated concentrations of NTZ. E. coli containing vector pMON6235Δcat served as a negative control for PapC expression. OM fractions isolated from normalized bacterial cultures were subjected to SDS-PAGE and Coomassie Blue staining to observe PapC and the overall OMP profile (top panels). Samples were also probed with anti-His tag and anti-BamA antibodies to visualize PapC and BamA, respectively (bottom panels). PapC levels were measured by densitometry of the anti-His tag blot, and percentage PapC levels were calculated relative to 0 μg/ml NTZ (D). The graph shows individual data points and means ± S.D. (error bars) from three independent experiments. ***, p < 0.001; ****, p < 0.0001 for comparison of OM PapC levels at each NTZ concentration.

