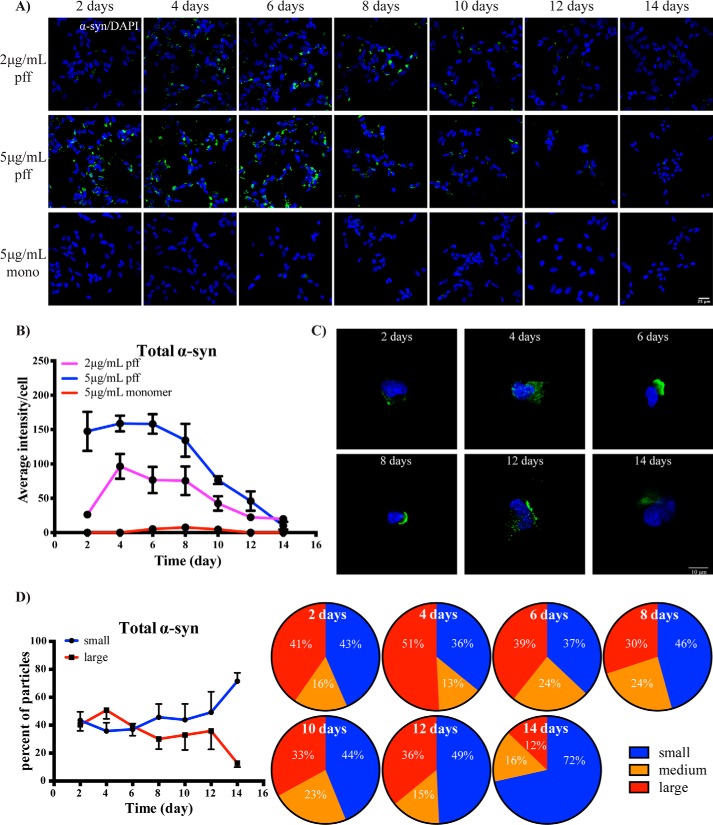
Figure 1.
Temporal changes in cytoplasmic α-synuclein inclusions following treatment of SH-SY5Y cells with PFFs. A, SH-SY5Y cells were treated with PFFs or α-synuclein monomer as indicated and then fixed for immunofluorescence staining of total α-synuclein (green) at the indicated time points. The blue is DAPI staining. Images were taken at 40× objective magnification. The scale bar is 25 μm. B, average intensity of particles >2 μm2 per cell were compared between PFF- and monomer-treated groups over time. Up to eight images, each containing 50–100 cells per image, were analyzed for each treatment condition. Data are shown as mean ± S.D. (error bars). C, representative images taken at 100× magnification show the morphology of α-synuclein inclusions (green) in SH-SY5Y cells treated with 5 μg/ml PFFs. The scale bar is 10 μm. D, the relative percentage of small (2–5 μm2), medium (5–10 μm2), and large (>10 μm2) α-synuclein (α-syn) inclusions in SH-SY5Y cells treated with 5 μg/ml PFFs and fixed at each time point are shown in the pie charts, with the quantified comparison between treatment groups shown in line graph as mean ± S.D. (error bars). Four to eight images were analyzed for each time point.

