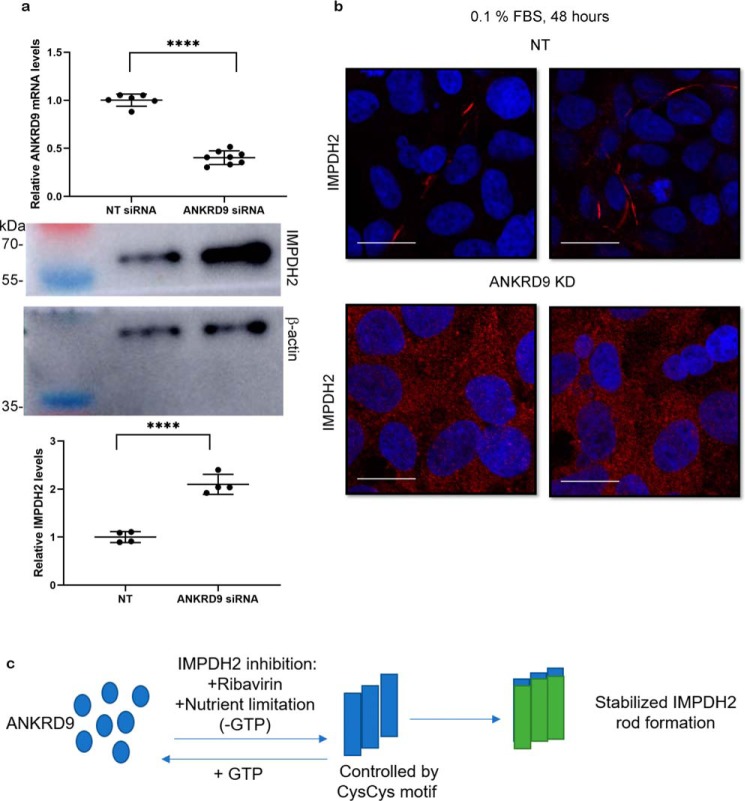
Figure 8.
ANKRD9 knockdown increases IMPDH2 expression and reduces rod formation under nutrient limiting conditions. a, top, HEK293A cells were transfected with nontargeted (NT) siRNA and ANKRD9 siRNA, and ANKRD9 mRNA levels were quantified. n = 6 for NT siRNA and n = 8 for ANKRD9 siRNA; Bottom: IMPDH2 levels in corresponding cells were analyzed by Western blotting with β-actin used as a loading control (lower panels). n = 3 for each condition. Decrease in ANKRD9 levels is associated with higher IMPDH2 abundance. ****, p < 0.0001 (unpaired t test). Error bar represents S.D. b, ANKRD9 down-regulation diminishes IMPDH2 rod formation under nutrient limitation (0.1% FBS). HEK293A cells were transfected with the indicated siRNAs and placed in 0.1% FBS for 48 h and immunostained for IMPDH2. IMPDH2 rods were apparent in control cells; no IMPDH2 rods are visible in cells treated with ANKRD9 siRNA. n = 3 for each condition. Scale bar, 20 μm. c, cartoon showing that ANKRD9 forms rods with inhibited IMPDH2 when GTP pools are lowered and stabilizes rods.

