Figure 5.
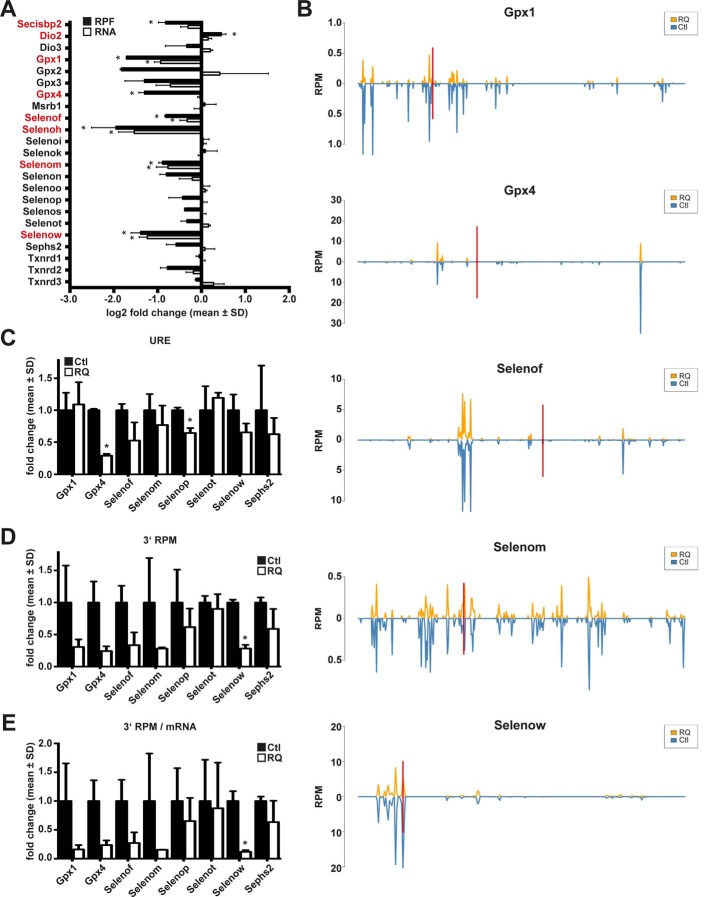
Selenoprotein expression in neuron-specific Secisbp2R543Q mice assessed by ribosomal profiling and RNA-Seq in cerebral cortex. A, relative abundance of selenoprotein-related reads in Ribo-Seq (RPF) and RNA-Seq (RNA) in RQ mice compared with controls. n = 2 per genotype. *, q < 0.05, BH correction. Significant changes are highlighted in red. B, RPF coverage of selected selenoprotein mRNAs. The position of the Sec/UGA codon is indicated by a red bar. Reads are plotted in blue for controls (Ctl) and in orange for CamK-Cre; Secisbp2R543Q/fl (RQ) mice. C, URE calculated for selenoproteins with UGA/Sec far from the termination codon. URE is calculated as (3′RPFmutant/5′RPFmutant)/(3′RPFcontrol/5′RPFcontrol). URE is not a good measure if mRNA levels or initiation rates change. D, 3′ RPM (reads 3′ of UGA/Sec per million mapped reads) calculated for selenoproteins. This measure gives a measure for the actual translation of full-length selenoproteins. E, 3′ RPM/mRNA is the same measure as in D, but normalized to mRNA abundance. C–E, *, p < 0.05, Student's t test. Error bars, S.D.

