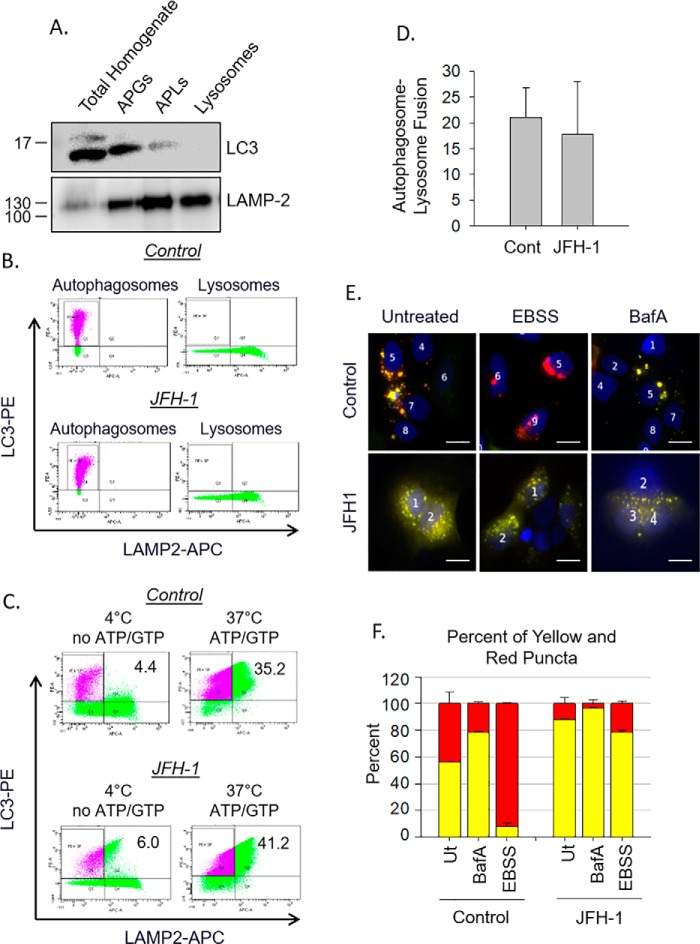
Figure 3.
Defects in autophagosome–lysosome fusion during HCV are due to trafficking. A, organelle fractions isolated from a discontinues Nycodenz gradient were collected and subjected to SDS-PAGE analysis. B, flow cytometry of individual vesicle fractions. Autophagosomes were incubated with anti-LC3-PE antibody, whereas lysosomes were incubated separately with anti-LAMP-2-APC. C, isolated autophagosomes and lysosomes from B were combined, and fusion was assessed as stated under “Experimental procedures.” Fusion is indicated by organelles that are both PE- and APC-positive. Controls for “no fusion” were incubated at 4 °C and had no ATP or GTP added to the reaction. D, the bar graph illustrates the amount of fusion of autophagosomes and lysosomes from control and JFH1-infected cells when compared with their “no fusion” controls. This graph is representative of three independent preparations and flow cytometry experiments. Differences between control and JFH1 were not significant. E, Huh-7.5 cells were transfected with RFP–GFP–LC3 plasmid and treated with either bafilomycin A1 (BafA) or EBSS. Fusion was determined by the loss of GFP fluorescence as indicated under “Experimental procedures.” Scale bars represent 10 μm. F, analysis of E showing the quantification (n = 64–107 cells in three individual experiments) of both yellow and red puncta in each treatment. Cont, control.

