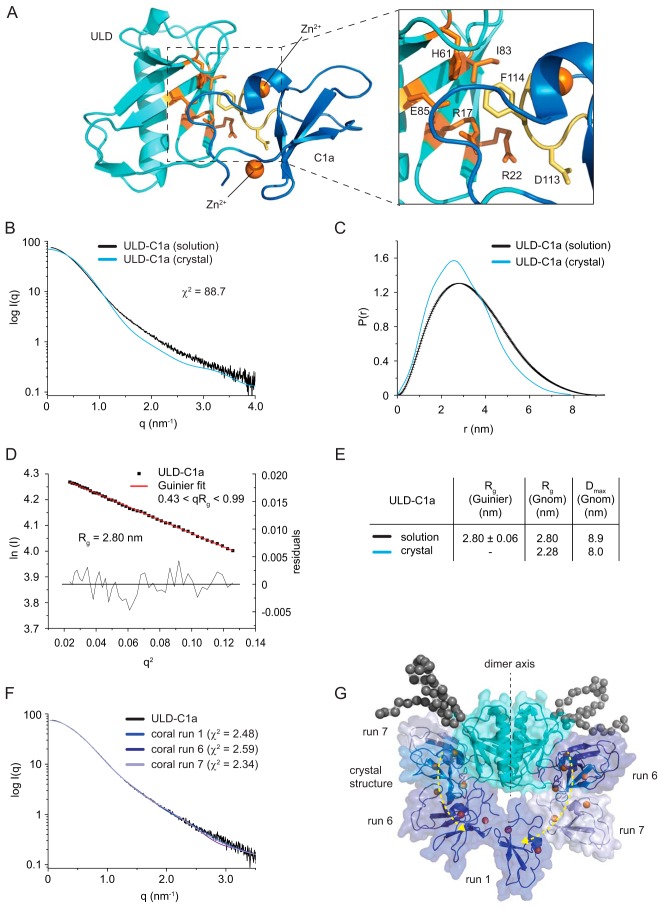
Figure 3.
The ULD dimer restricts the orientation of the membrane-binding sites of the C1 domain. A, The orientation of the C1 domain with respect to the ULD is mediated by a patch of conserved residues on the ULD (orange) and C1a (yellow). B, small-angle X-ray scattering curve of the crystallized protein (DKF-11–151) in solution (black line) compared with the theoretical scattering curve calculated from the crystal structure (blue line) using CRYSOL (32). The high χ2 value indicates that the crystal structure does not match the solution scattering. C, pair distribution function of DKF-11–151 derived from the SAXS data (black line) and the crystal structure (blue line). D, Guinier plot of the solution scattering data. The interval of 0.43 < qRg < 0.99 was used to determine the radius of gyration (Rg) by a linear regression of the data. Residuals of the fit are shown below. E, comparison of the Rg and the maximum dimension (Dmax) of the ULD–C1a protein derived from the solution-scattering data (solution) and calculated from the crystal structure (crystal). The radius of gyration was derived either from the Guinier plot or from the pair distribution function. F, rigid-body modeling of the ULD–C1a using CORAL (32). Shown is the scattering curve of the ULD–C1a in solution (black line) and theoretical scattering curves of models that best fit the experimental scattering. The χ2 values represent the goodness of fit of the models to the experimental data. G, superposition of the crystal structure and the structures obtained by rigid-body modeling with the lowest χ2 values (see F). Black spheres represent dummy spheres for N-terminal residues not visible in the crystal structure.

