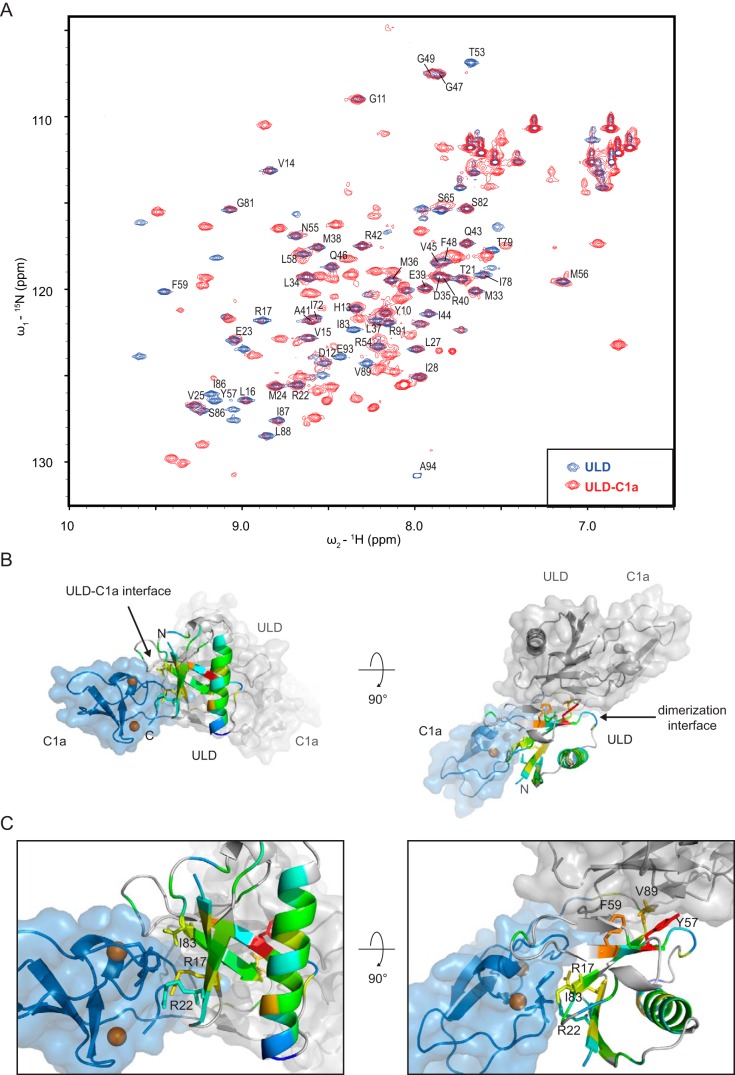
Figure 4.
The ULD and C1a domain interact reversibly in solution. A, overlay of 15N and 1H resonances of two HSQC experiments on DKF-11–94 (ULD, blue peaks) and DKF-11–151 (ULD–C1a, red peaks). B, changes in peak intensities of the amide backbone 15N and 1H cross-resonances as seen in Fig. 4A were mapped onto the ULD of the crystal structure. The color code is from blue (no decrease in intensity) to red (highest change in intensity). Peaks that could not be assigned are represented in gray. C, close-up of B. Some of the residues in the ULD C1a interface (Arg17, Arg22, and Ile83), but also in the dimerization interface (Tyr57, Phe59, and Val89) display altered intensity.

