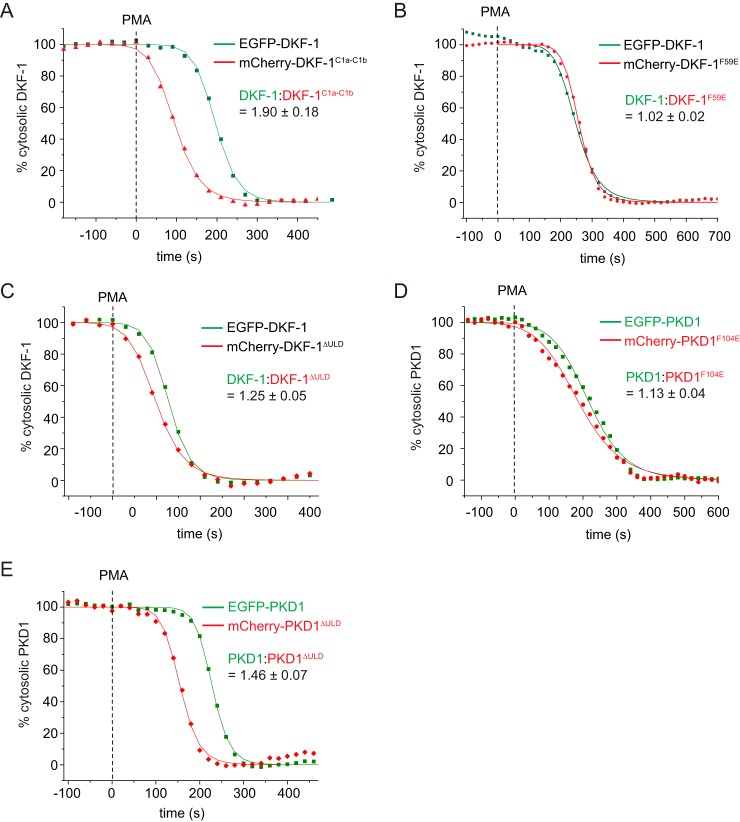
Figure 6.
The ULD stabilizes the autoinhibited conformation of PKDs in cells. A–E, live cell membrane translocation assay. Cytoplasmic fluorescence intensities of COS7 cells co-expressing EGFP- and mCherry-tagged PKD variants measured by confocal microscopy. The fluorescent tags are spectrally separated, and the depletion of cytoplasmic intensity is monitored upon the addition of the plasma membrane ligand PMA at the indicated time points (squares or triangles). Depletion of cytosolic fluorescence intensity was fitted with a logistic fit function (line) to determine half-maximum translocation time. Depicted is one representative translocation curve for WT and mutant PKD proteins from a single cell. The mean ratio of the half-maximum translocation time and the respective S.D. was determined from several individual cells (n ≥ 4). A, EGFP-tagged full-length DKF-1 (DKF-11–722) was co-expressed with mCherry-tagged C1a-C1b domains (DKF-195–239); n = 5. B, EGFP-tagged full-length DKF-1 (DKF-11–722) co-expressed with mCherry-tagged DKF-1 carrying the monomerizing point mutation in the ULD (DKF-1F59E); n = 6. C, EGFP-tagged full-length DKF-1 (DKF-11–722) co-expressed with mCherry-tagged DKF-1 lacking the ULD (DKF-1ΔULD); n = 4. D, EGFP-tagged human full-length PKD1 (PKD11–912) co-expressed with mCherry-tagged PKD1 carrying the monomerizing point mutation in the ULD (PKD1F104E); n = 5. E, EGFP-tagged human full-length PKD1 (PKD11–912) co-expressed with mCherry-tagged PKD1 lacking the ULD (PKD1ΔULD); n = 4.

