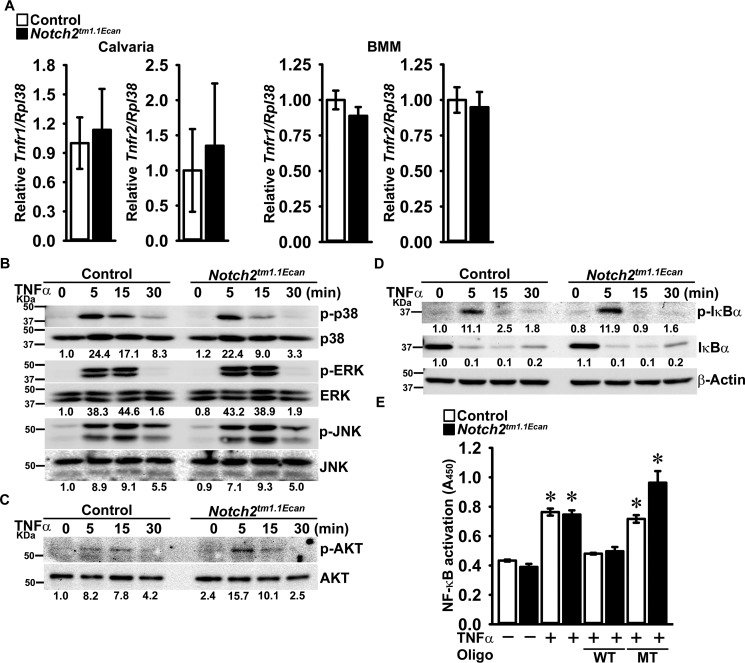
Figure 3.
TNFα receptor expression and TNFα-induced early signal activation are not altered in Hajdu Cheney mutants. A, total RNA was extracted from calvarial bones (left) or BMMs (right) of Notch2tm1.1Ecan and sex-matched littermate control mice and examined for relative Tnfr1 and Tnfr2 gene expression by qRT-PCR, corrected for Rpl38 copy number. Values are means ± S.D.; n = 4 biological replicates for control (white bars) and Notch2tm1.1Ecan (black bars) calvarial bones or BMMs. B–D, BMMs derived from 2-month-old Notch2tm1.1Ecan mice and control littermates were cultured for 2 h in the absence of serum and exposed to TNFα at 200 ng/ml for the indicated periods of time, and whole-cell lysates (35 μg of total protein except panel C, 15 μg of total protein for C) were examined by immunoblotting. B, using anti-p-p38, p-ERK, and p-JNK antibodies, stripped and reprobed with anti-p38, ERK, and JNK antibodies. C, using anti-p-AKT antibodies and reprobed with anti-AKT antibodies. D, using anti-p-IκBα or β-Actin antibodies, stripped and reprobed with IκBα antibodies. The band intensity was quantified by ImageLabTM software (version 5.2.1), and the numerical ratios of phosphorylated/unphosphorylated signal in B and C or of p-IκBα/β-Actin and of IκBα/β-Actin in D are shown below each blot. Control ratios at day 0 are normalized to 1. E, BMMs from 2-month-old Notch2tm1.1Ecan mice and control littermates were cultured for 2 h in the absence of serum and exposed to TNFα at 200 ng/ml for 1 h. 20 μg of nuclear extracts for each sample were examined by TransAMTM Flexi NF-κB p65 activation assay kit, and colorimetric changes were measured at 450 nm. Values are means ± S.D.; n = 3 technical replicates for control (white bars) and Notch2tm1.1Ecan (black bars) BMMs. *, significantly different compared with control without TNFα, p < 0.05.

