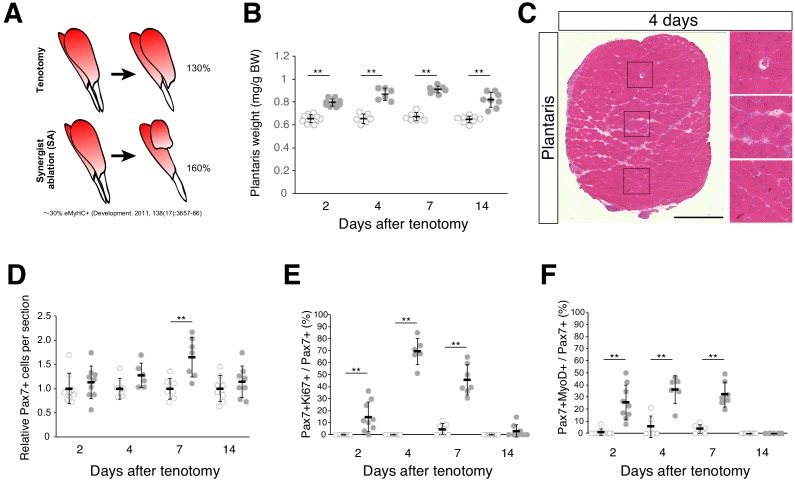
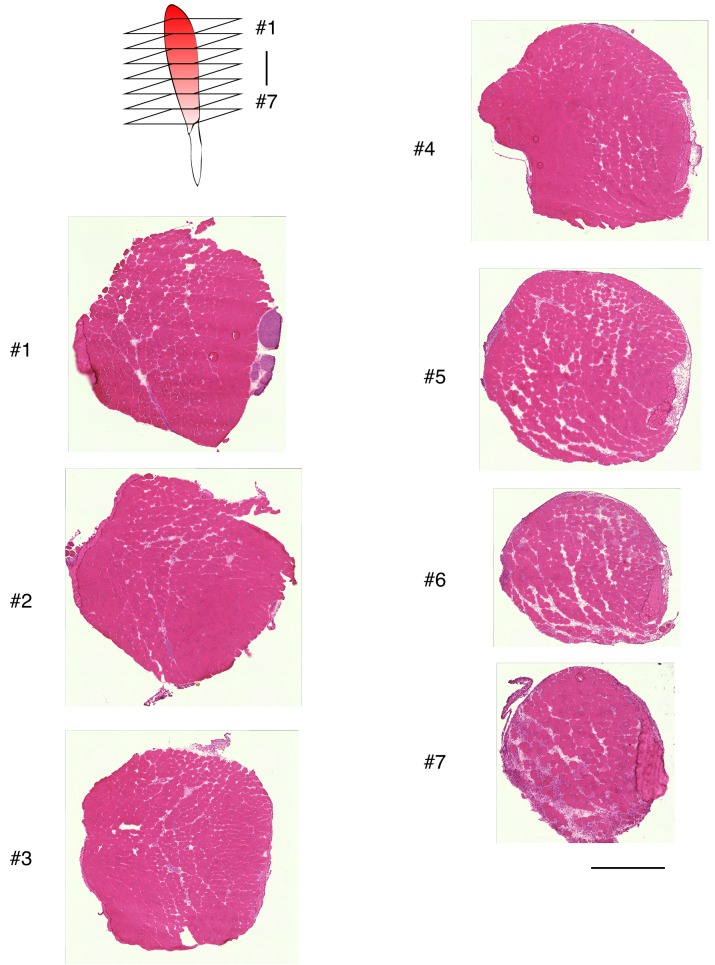
Figure 1. Tenotomy induces activation and proliferation of muscle stem cells in the absence of substantial muscle damage.
(A) Two mouse models that induce muscle hypertrophy. (B) Plantaris muscle weight relative to body weight (mg/g) after tenotomy (gray circle) or the weight of contralateral sham-operated muscle (open circle). **p<0.01. (C) H and E staining of plantaris muscle sections at 4 days after tenotomy. Scale bar: 500 µm. Right three images in squares represent magnifications of the left image. (D) Relative number of MuSCs in plantaris muscle sections after tenotomy (gray circle) or in contralateral sham muscle sections (open circle). **p<0.01. (E) Percentage of Ki67+ cells among Pax7+ cells in contralateral sham (open circle) or tenotomy induced plantaris muscle (gray circle). **p<0.01. (F) Percentage of MyoD+ cells among Pax7+ cells in contralateral sham (open circle) or tenotomy induced plantaris muscle (gray circle). **p<0.01. Data represent the means ± standard deviation. A two-sided Student’s t test or Welch’s t test was performed.


