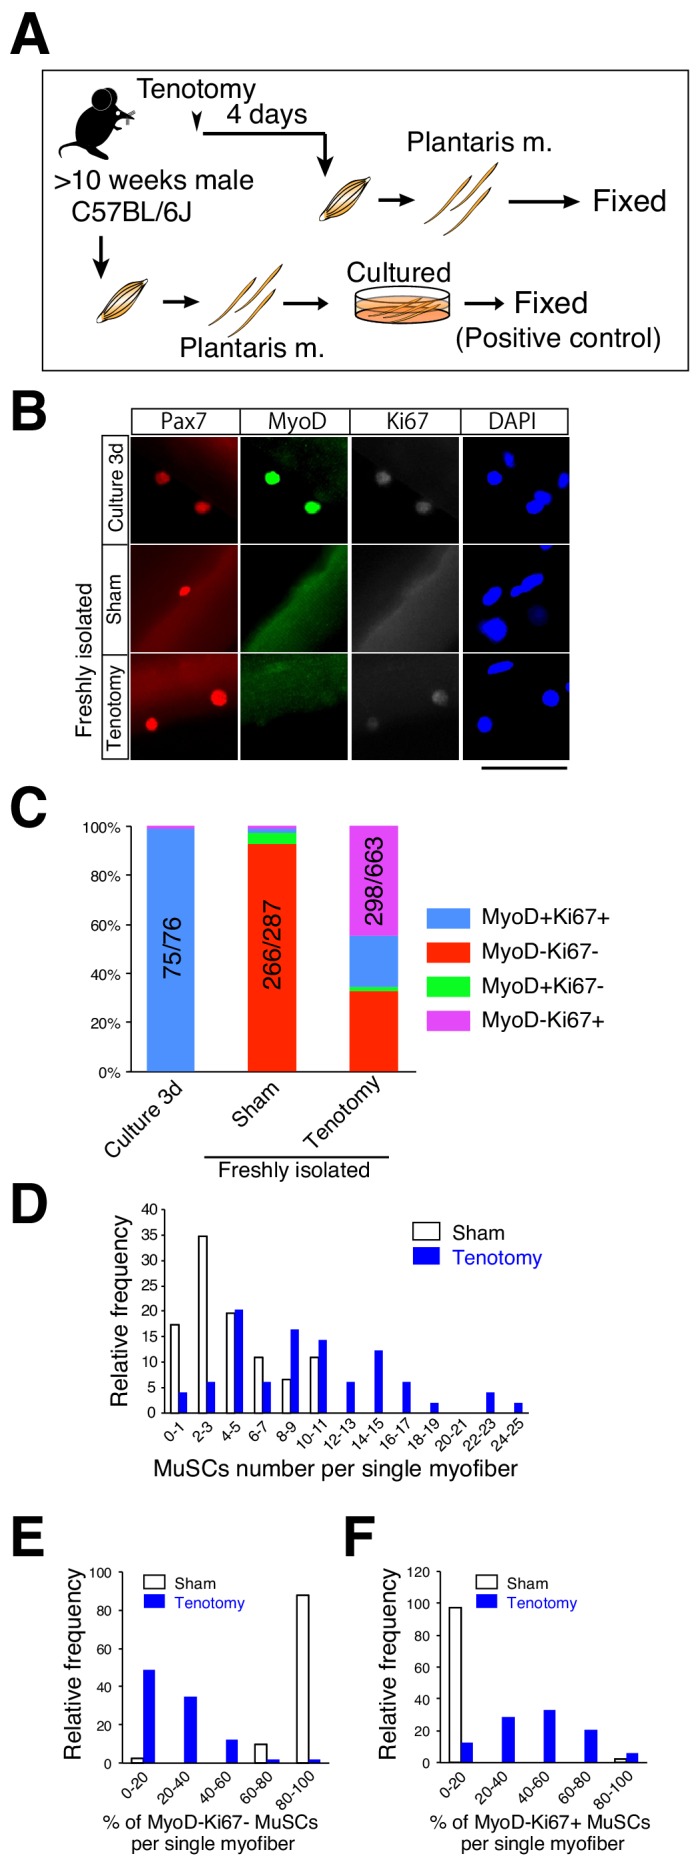
Figure 2. Majority of muscle stem cells proliferate on undamaged overloaded myofibers in the absence of MyoD expression.

(A) Experimental scheme for analyzing the number and properties of MuSCs on isolated single myofibers. At 4 days after tenotomy, single myofibers were isolated and immediately fixed. Single myofibers cultured for 3 days were used as positive controls for immunostaining. (B) Immunostaining of Pax7 (red), MyoD (green), and Ki67 (white) in MuSCs on 3 day cultured myofibers (Culture 3d; positive control), freshly isolated myofibers of sham muscle (Sham), or freshly isolated myofibers at 4 days after tenotomy (Tenotomy). Nuclei were counterstained with DAPI. Scale bar: 50 μm. (C) Bar graph showing frequencies of MyoD+Ki67+ (blue column), MyoD−Ki67− (red column), MyoD+Ki67− (green column), and MyoD−Ki67+ (purple column) cells on 3 day cultured myofibers, sham myofibers, or myofibers at 4 days after tenotomy. The number associated with the majority phenotype in Pax7+ cells is indicated in the numerator of each bar. Total number of Pax7+ cells is indicated in the denominator of each bar. (D) Histogram showing the frequency of the listed number of MuSCs per myofiber in the case of sham myofibers (white bar, n = 46) or myofibers at 4 days after tenotomy (blue bar, n = 49). The X-axis indicates the number of MuSCs per myofiber, and the Y-axis shows the frequency of myofibers harboring the indicated number of MuSCs. (E, F) Frequency of MyoD−Ki67− (E) or MyoD−Ki67+ (F) MuSCs on single myofibers: sham control (white bar, n = 41) versus 4 days after tenotomy (blue bar, n = 49). The X-axis indicates the percentage of MyoD−Ki67− or MyoD−Ki67+ MuSCs per myofiber. The Y-axis shows the frequency of myofibers with the indicated percentage of MyoD−Ki67− (E) or MyoD−Ki67+ (F) MuSCs per myofiber.
