. 2019 Sep 23;8:e48284. doi: 10.7554/eLife.48284

Figure 4. Increased ratio of MyoD-expressing myogenic cells and decreased cell number in overloaded HeyL-KO mice.

(A) Experimental scheme for analyzing Pax7+ cells on plantaris myofibers derived from control (Cont), Hey1-KO (1KO), or HeyL-KO (LKO) mice at 4 days after tenotomy (Ope). (B) Immunostaining of Pax7 (red), MyoD (green), and Ki67 (white) in MuSCs on freshly isolated myofibers at 4 days after tenotomy from Cont, 1KO, or LKO mice. Nuclei were counterstained with DAPI. Scale bar: 20 μm. (C) Frequency of MyoDKi67+ (left) or MyoD+Ki67+ (right) cells among Pax7+ cells on myofibers: sham (open circle) versus 4 days after tenotomy (closed circle), derived from Cont (light gray, n = 5), 1KO (black, n = 4), or LKO (blue, n = 5) mice. **p<0.01. N.S.: not significant. (D) Ratio of MyoD+ to MyoD cells among Ki67+Pax7+ cells on myofibers at 4 days after tenotomy, derived from Cont (light gray, n = 5), 1KO (black, n = 4), or LKO (blue, n = 5) mice. **p<0.01. N.S.: not significant. (E) Number of Pax7+ cells on myofibers: sham (open circle) versus 4 days after tenotomy (closed circle), derived from Cont (light gray, n = 5), 1KO (black, n = 4), or LKO (blue, n = 5) mice. **p<0.01. N.S.: not significant. Data represent the mean ± standard deviation. One-way ANOVA, followed by the Tukey–Kramer test, was used for statistical analyses.

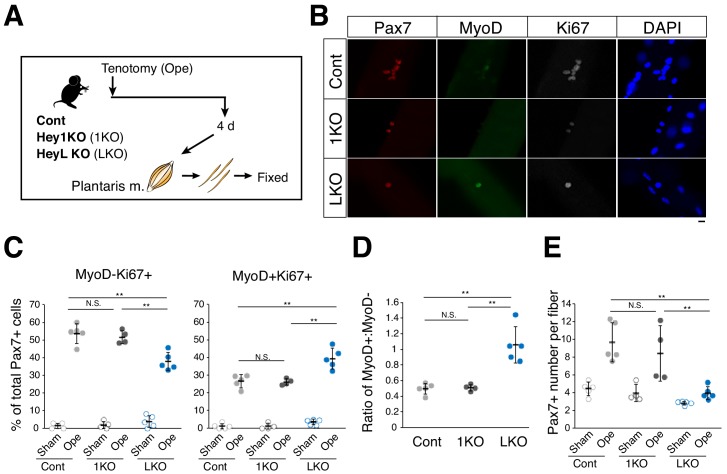
Figure 4—source data 1. Numerical data for making the graphs in Figure 4.
Experiment number corresponds to all results.
DOI: 10.7554/eLife.48284.016

Figure 4.

Figure 4—figure supplement 1. Increased ratio of MyoD-expressing myogenic cells and decreased cell number in overloaded HeyL-KO mice at 7 days after tenotomy.

Figure 4—figure supplement 1.

(A) Experimental scheme for analyzing Pax7+ cells on plantaris myofibers derived from control (Cont), Hey1-KO (1KO), or HeyL-KO (LKO) mice at 7 days after tenotomy (Ope) or derived from corresponding contralateral control muscles (Sham). (B) Frequency of MyoDKi67+ (left) or MyoD+Ki67+ (right) cells among Pax7+ cells on myofibers: sham (open circle) versus 7 days after tenotomy (closed circle) and derived from Cont (light gray, n = 3), 1KO (black, n = 4), or LKO (blue, n = 3) mice. **p<0.01. N.S.: not significant. (C) Ratio of MyoD+ to MyoD cells among Ki67+Pax7+ cells on myofibers at 7 days after tenotomy and derived from Cont (light gray, n = 3), 1KO (black, n = 4), or LKO (blue, n = 3) mice. **p<0.01. N.S.: not significant. (D) Number of Pax7+ cells on myofibers: sham (open circle) versus 7 days after tenotomy (closed circle) and derived from Cont (light gray, n = 3), 1KO (black, n = 4), or LKO (blue, n = 3) mice. N.S.: not significant. Data represent the mean ± standard deviation. One-way ANOVA, followed by the Tukey–Kramer test, was used for statistical analyses.
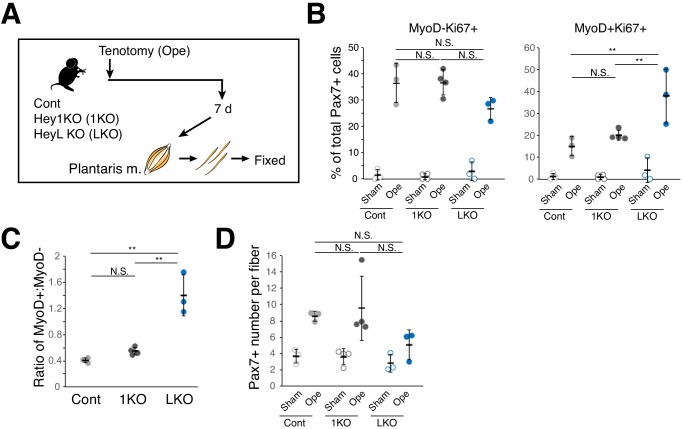
Figure 4—figure supplement 1—source data 1. Numerical data for making the graphs in Figure 4—figure supplement 1.
Experiment number corresponds to all results.
DOI: 10.7554/eLife.48284.011
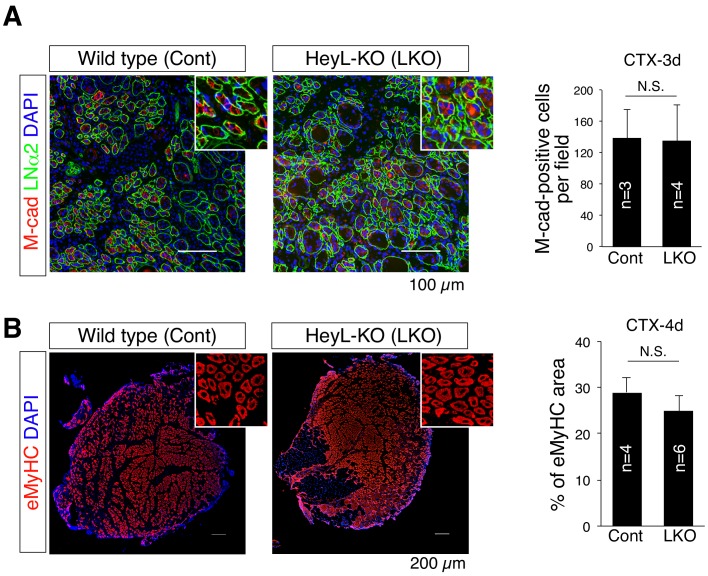
Figure 4—figure supplement 2. Normal muscle-regenerative ability in HeyL-KO mice.

Figure 4—figure supplement 2.

(A) Immunostaining of M-cadherin (M-cad; red) and laminin α2 (LNα2; green) in sections of regenerating tibialis anterior muscle at 3 days after CTX injection (CTX-3d). Scale bar: 100 μm. Bar graph shows the frequency of M-cadherin+ cells per field in wild-type (Cont; n = 3) and HeyL-KO (LKO; n = 4) mice. N.S.: not significant. (B) Immunostaining of embryonic myosin heavy chain (eMyHC; red) in sections of regenerating tibialis anterior muscle at 4 days after CTX injection (CTX-4d). Scale bar: 200 μm. Bar graph shows percentages of eMyHC+ area in wild-type (Cont; n = 4) and LKO (n = 6) mice. N.S.: not significant. Data represent the mean ± standard deviation. A two-sided Student’s t test was performed.
Figure 4—figure supplement 2—source data 1. Numerical data for making the graphs in Figure 4—figure supplement 2.
DOI: 10.7554/eLife.48284.013
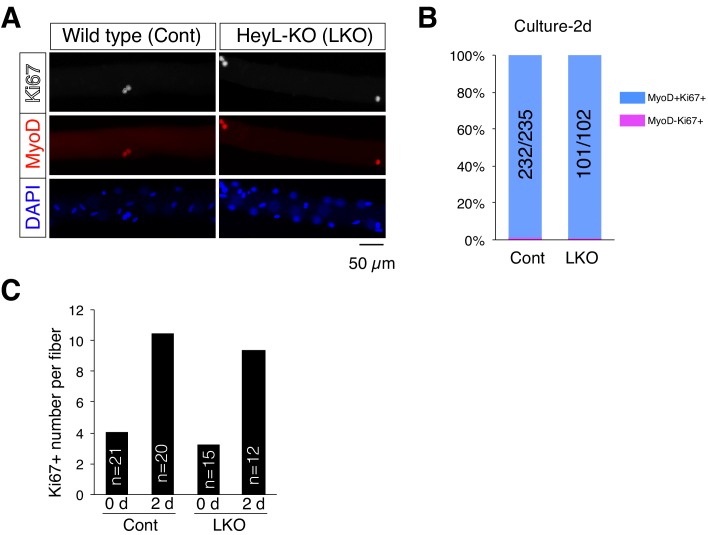
Figure 4—figure supplement 3. Normal activation and proliferation ability of HeyL-KO MuSCs on cultured myofibers.

Figure 4—figure supplement 3.

(A) Immunostaining of 2 day cultured myofibers from wild-type (Cont) and HeyL-KO (LKO) mice using Ki67 (white) and MyoD (red) antibodies. Nuclei were stained with DAPI (blue). Scale bar: 50 μm. (B) Bar graph showing the percentage of MyoD+ or MyoD cells among Ki67+ cells on 2 day cultured myofibers from wild-type (Cont) and LKO mice. The number of MyoD+ cells among Ki67+ cells is indicated in the numerator of each bar, and the number of Ki67+ cells is indicated in the denominator of each bar. (C) Bar graph showing the average number of Ki67+ cells per freshly isolated (0 d) or 2 day cultured (2 d) myofibers. The numbers in the graphs indicate the counted myofibers.
Figure 4—figure supplement 3—source data 1. Numerical data for making the graphs in Figure 4—figure supplement 3.
DOI: 10.7554/eLife.48284.015