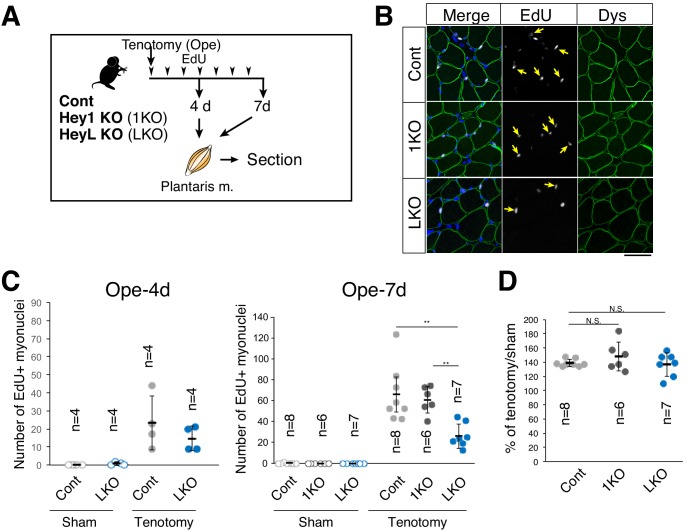
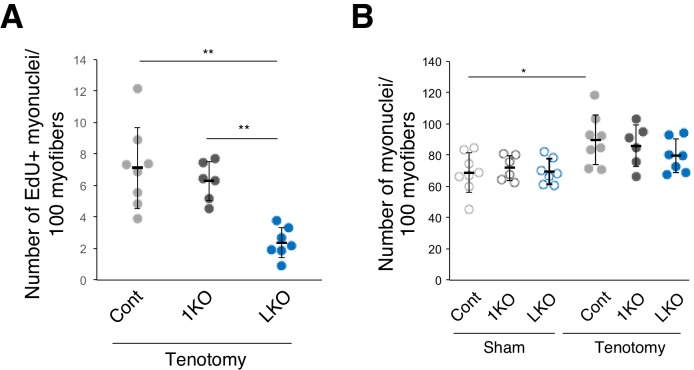
Figure 5. Decreased number of new myonuclei supplied by muscle stem cells in overloaded HeyL-KO muscle.
(A) Experimental scheme for analyzing new MuSC-derived myonuclei in plantaris muscle of control (Cont), Hey1-KO (1KO), or HeyL-KO (LKO) mice at 4 or 7 days after tenotomy. Arrowheads indicate the day of EdU injection. (B) Arrows indicate new myonuclei supplied by MuSCs in overloaded muscle of Cont, 1KO, or LKO mice. MuSC-derived myonuclei were labeled with EdU (white) and located inside the staining for dystrophin (Dys; green). Nuclei were counterstained with DAPI. Scale bar: 50 μm. (C) Number of EdU+ myonuclei in muscle: sham (open circle) versus tenotomy (closed circle). Left graph: results at 4 days after tenotomy (Ope-4d) (Cont: light gray, n = 4; LKO: blue, n = 4). Right graph: results at 7 days after tenotomy (Cont: light gray, n = 8; 1KO: black, n = 6; LKO: blue, n = 7). **p<0.01. N.S.: not significant. (D) Ratio of overloaded muscle weight to sham muscle weight in Cont (light gray, n = 8), 1KO (black, n = 6), or LKO (blue, n = 8) mice at 7 days after tenotomy. N.S.: not significant. Data represent the mean ± standard deviation. One-way ANOVA, followed by the Tukey–Kramer or Bonferroni test, was used for statistical analyses.


