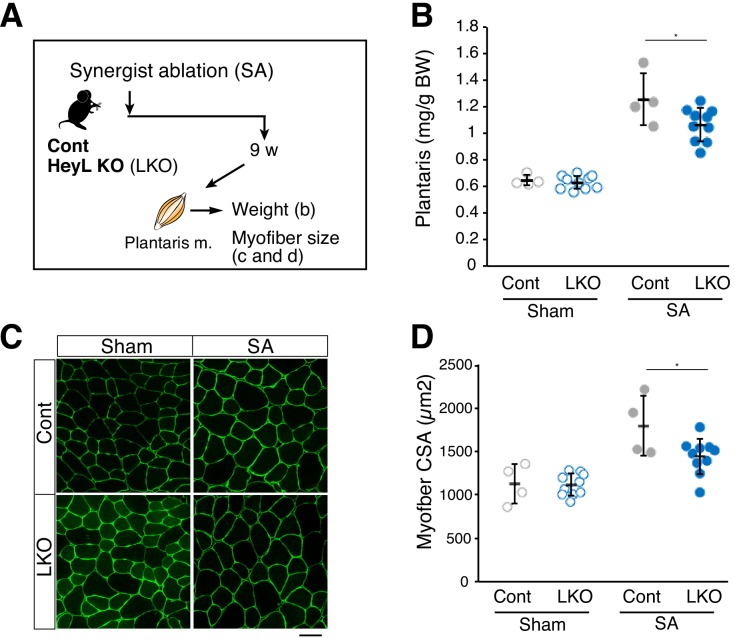
Figure 6. Blunted hypertrophy in HeyL-KO mice at 9 weeks after synergist ablation (SA).
(A) Experimental scheme for analyzing the influence of HeyL-KO (LKO) on overloaded plantaris muscle at 9 weeks after SA. (B) Normalized plantaris muscle weight [muscle weight/body weight (BW)] from sham (open circle) or SA (closed circle) muscle derived from Cont (light gray, n = 4) or LKO mice (blue, n = 10). *p<0.05. N.S.: not significant. (C) Immunostaining of laminin α2 (green) in sham or SA plantaris muscle derived from Cont or LKO mice. Scale bar: 50 μm. (D) Average myofiber cross-sectional area (CSA) values from sham (open circle) or SA (closed circle) plantaris muscle derived from Cont (light gray, n = 4) or LKO mice (blue, n = 10). *p<0.05. N.S.: not significant. Data represent the mean ± standard deviation. One-way ANOVA, followed by the Tukey–Kramer test, was used for statistical analyses.
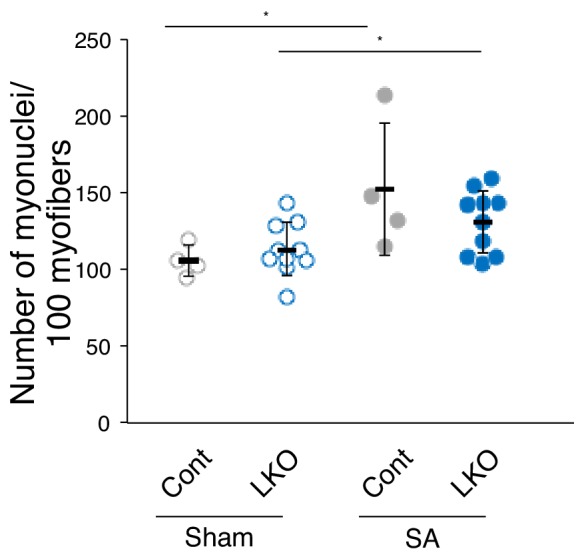
Figure 6—figure supplement 1. Number of total myonuclei per 100 myofibers 9 weeks after SA.


