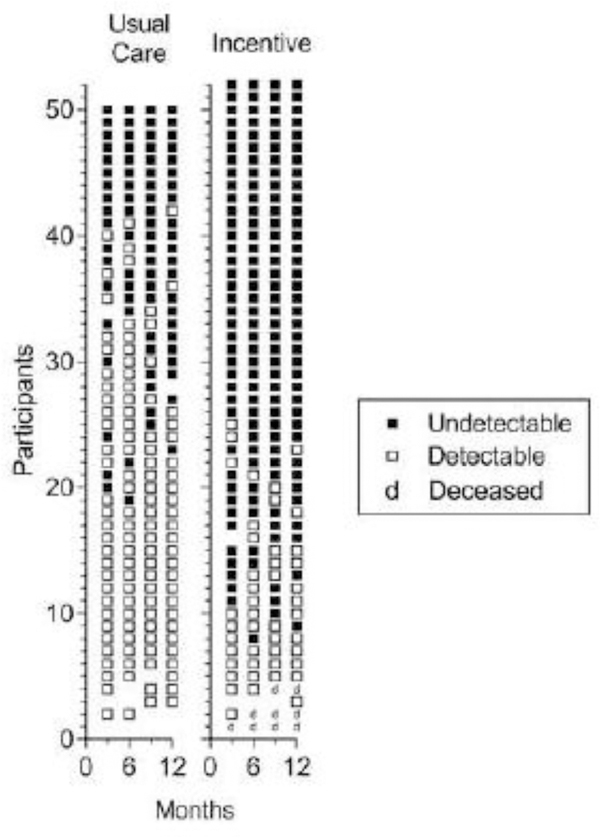
Fig. 3.
Consecutive viral load results for all blood samples collected at 3-month assessments from Usual Care (left panel) and Incentive (right panel) participants. Within each panel, each row of points represents data for the 3-, 6-, 9-, and 12-month assessment time points for a participant. Solid and open squares represent blood samples with undetectable (<200 copies/mL) and detectable viral loads, respectively. Blank spaces indicate missed samples and deceased individuals are represented by a “d.” Within each panel, participants are arranged from those showing the most blood samples with undetectable viral loads at the top to those with the fewest blood samples with undetectable viral loads at the bottom. The difference between groups was statistically significant (Odds Ratio = 15.6; 95% CI = 4.2–58.8; P<0.001).

