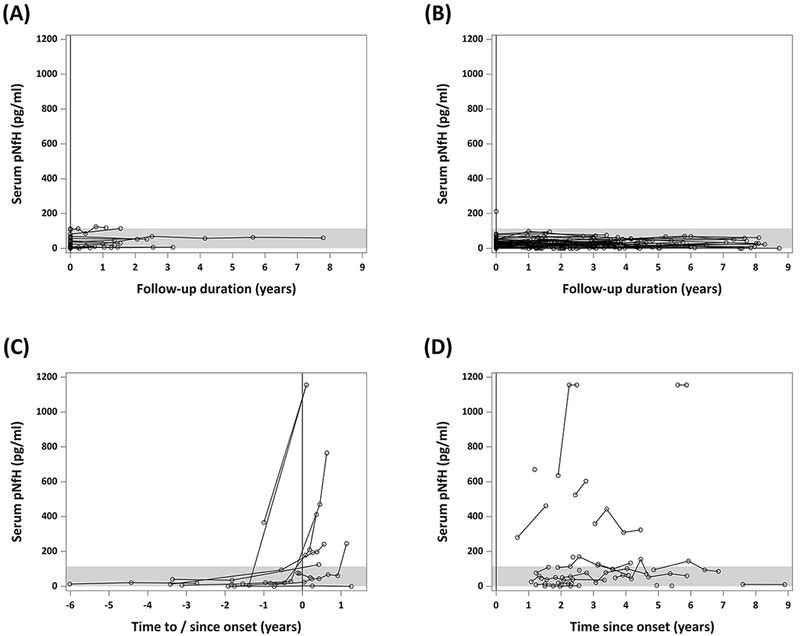
Figure 3. Longitudinal changes in serum pNfH concentrations (pg/ml).

(A) Controls; (B) at-risk individuals who remain pre-symptomatic throughout follow-up; (C) phenoconverters; and (D) ALS patients. The x-axis in (A) and (B) shows years since baseline. The x-axis in (C) and (D) shows years to or since the onset of symptoms/signs, which is marked by the vertical dashed line at year = 0. ALS = amyotrophic lateral sclerosis; pNfH = phosphorylated neurofilament heavy. Shading indicates the 95th percentile of all available data among controls.
