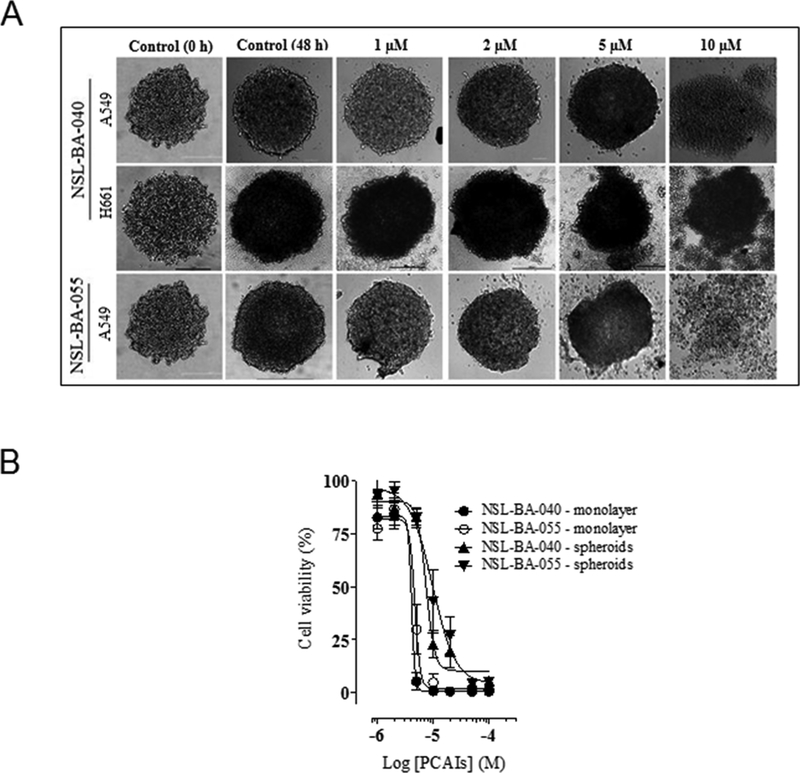
Figure 3. PCAIs induce degeneration of 3D spheroid cultures.
A549 and H661 cells plated at 20,000 cells/well in a low-attachment, U-shaped, black clear-bottom plates. Images were acquired 24 h post-plating and 48 h after treatment. Representative images of spheroids treated with different PCAIs concentrations are shown in (A). Spheroids treated with high concentrations of PCAIs appear to disintegrate. Cell viability was determined after the final treatment with PCAIs (1 – 50 μM) by fluorescence using the resazurin reduction assay in (B). The EC50s were higher in the spheroids (7.4 and 9.7 μM for NSL-BA-040 and NSL-BA-055, respectively) compared to that of the 2D culture for both compounds (4.1 and 4.7 μM for NSL-BA-040 and NSL-BA-055, respectively). Each point represents the mean ± SEM relative to the control untreated cells.

