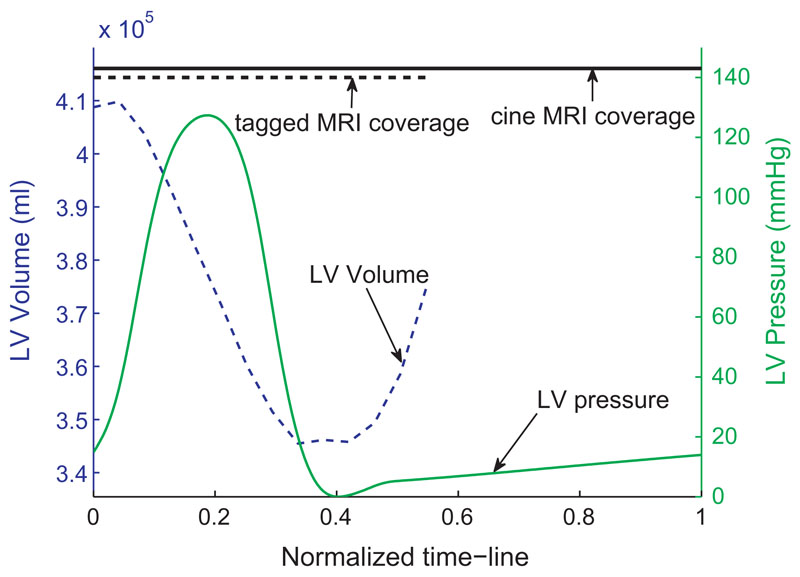
Fig. 2.
The coverage of cine and tagged MRI, pressure transient, and derived volume transient for patient case 1. The x-axis is the normalized heart cycle (R–R interval). The top horizontal line shows the coverage of the 29 frames of cine MRI and the 23 frames of tagged MRI. The beginning of diastole is at the frame 18 of the tagged MRI sequence, and thus five frames at early diastole are available while the frame of end-diastole is assumed to be synchronous to the R wave. The volume transient is calculated as the LV cavity volume of the fitted FM meshes (described in Section 2.3.2). The pressure transient is the averaged value recorded over multiple heart cycles.

