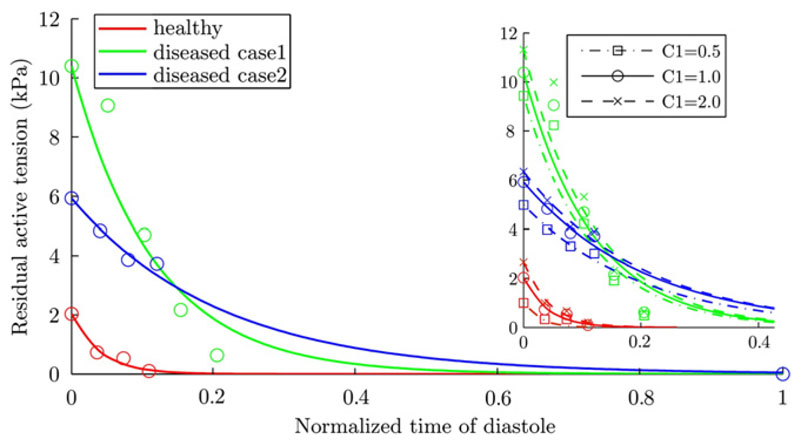
Fig. 7.
The estimated residual diastolic active tensions (Tz term defined in Eq. (16)) with its sensitivity against C1 assumption shown in the right panel. The data points show the optimized values of residual tension for each frame. The lines are the exponential fits to the data points. The time-line is the normalized time in a heart cycle, starting with end-diastole. Because limitations in clinical data acquisition protocol, tagged MRI only covers roughly one third of the early diastole. The residual AT of the two patient cases are significantly higher than the healthy one, indicating a delayed tension decay. The differences among the estimated AT using C1 = 0.5, 1.0, and 2.0 are very small, and this variability introduced by varying C1 is much smaller than the difference across patsient cases.

