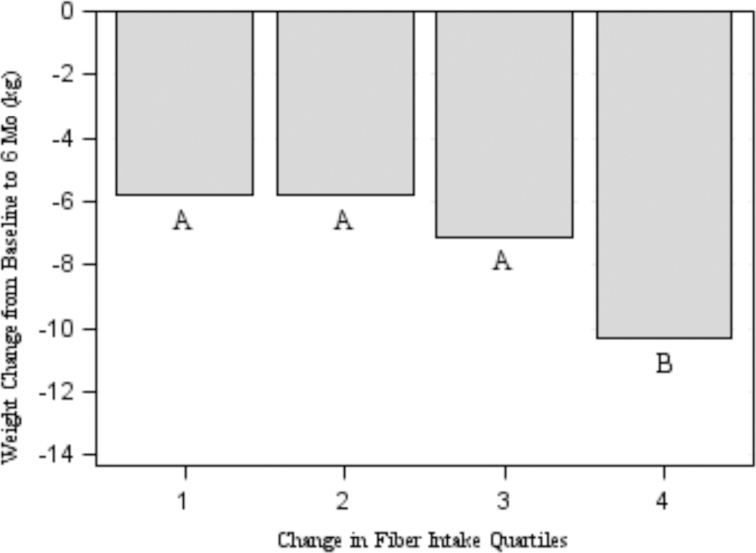
FIGURE 1.

Change in body weight by quartiles of change in fiber intake from baseline to 6 mo in the full sample of adults with overweight/obesity who provided complete dietary recalls for both time points (n = 345). Values for change in fiber intake quartiles are as follows: quartile 1 (n = 86) is −25.01 to −1.78 g/d; quartile 2 (n = 86) is −1.69 to 2.34 g/d; quartile 3 (n = 87) is 2.41–8.33 g/d; and quartile 4 (n = 86) is 8.33–29.39 g/d. Mean ± SD body-weight changes from baseline to 6 mo were −5.8 ± 5.0, −5.8 ± 4.9, −7.1 ± 4.9, and −10.3 ± 6.3 kg for quartiles 1, 2, 3, and 4, respectively. Letters (A–B) indicate pairwise differences between quartiles using Bonferroni's correction for multiple comparisons (α = 0.01).
