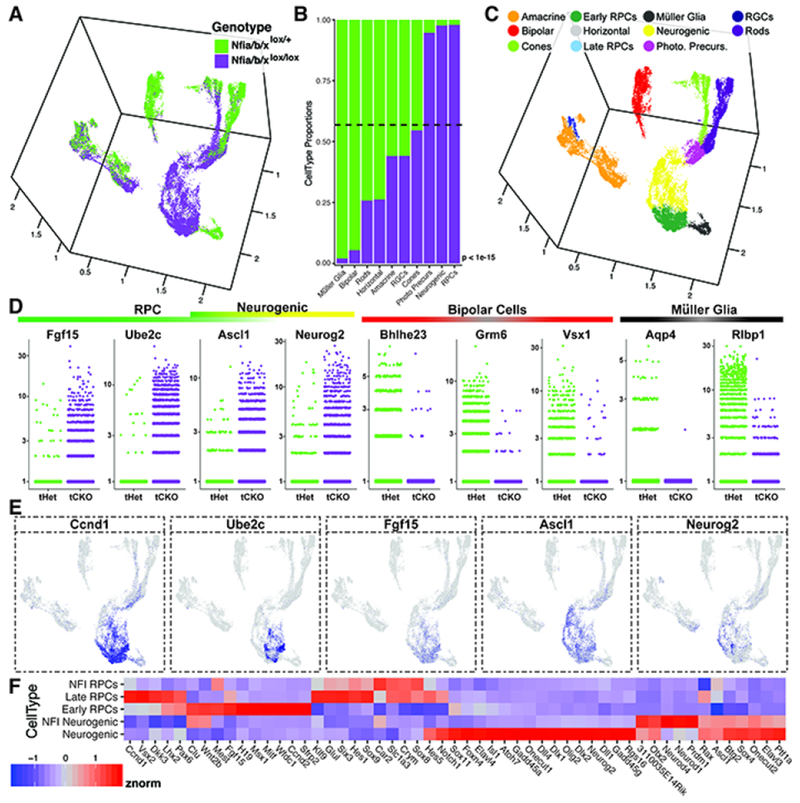
Figure 7. ScRNA-seq analysis of Nfia/b/x mutants.
(A) UMAP dimension reduction of scRNA-seq on P14 Nfia/b/x triple conditional knockouts and heterozygous controls, colored by genotype. (B) Genotype comparisons of the proportions of cell types obtained from scRNA-seq experiments. (C) UMAP dimension reduction of NFI mutant and control scRNA-seq experiments colored by annotated cell type. (D) Jitter plots of the cellular expression of marker genes of primary RPCs, neurogenic cells, bipolar cells, and Müller glia, faceted by genotype. (E) UMAP dimension reduction plots of cellular expression of primary RPC markers (Ccnd1, Ube2c, Fgf15, Ascl1) and markers of neurogenic cells (Ascl1 and Neurog2). Cellular expression is colored on a scale of low (grey) to high (blue) expression. (F) Heatmap displaying the relative expression levels of transcripts within Nfia/b/x mutant primary and neurogenic RPCs compared to early and late primary and neurogenic wild-type RPCs from the developmental dataset. Abbreviations: Photo. Precurs. - Photoreceptor Precursors; tHet - triple Nfia/b/x Heterozygous Chx10-Cre (+); tCKO - triple Nfia/b/x conditional knock-out. P-values (B) are the result of a chi square test for proportions of cells by genotype.

