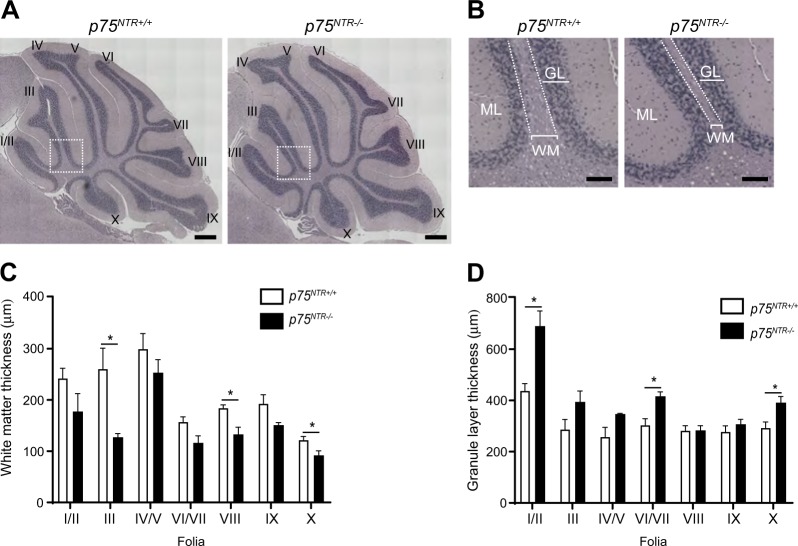
Fig. 4. Cerebellar white matter thickness is reduced in adult p75NTR−/− mice.
a Hematoxylin and eosin staining of adult (6–9 months) p75NTR+/+ and p75NTR−/− cerebella. Boxed areas indicate the fields shown in b. I/II, III, IV, V, VI, VII, VIII, IX and X indicate the cerebellar folia. Scale bars, 500 µm. b High-magnification images of folium III of p75NTR+/+ and p75NTR−/− cerebella. Examples of WM and GL thickness are highlighted (white brackets). Dotted line delineates the GL/WM boundary. Scale bars, 150 µm. c, d Quantification of WM (c) and GL (d) thickness of the different cerebellar folia. The measurements were done at the base of each folia as shown by the white brackets in b. Ten cerebellar sections were quantified for each animal. Mean ± s.e.m of data from four p75NTR+/+ and three p75NTR−/− mice. *p < 0.05 compared to p75NTR+/+ (unpaired Student’s t-test). Abbreviations: WM, white matter; GL, granule layer; ML, molecular layer

