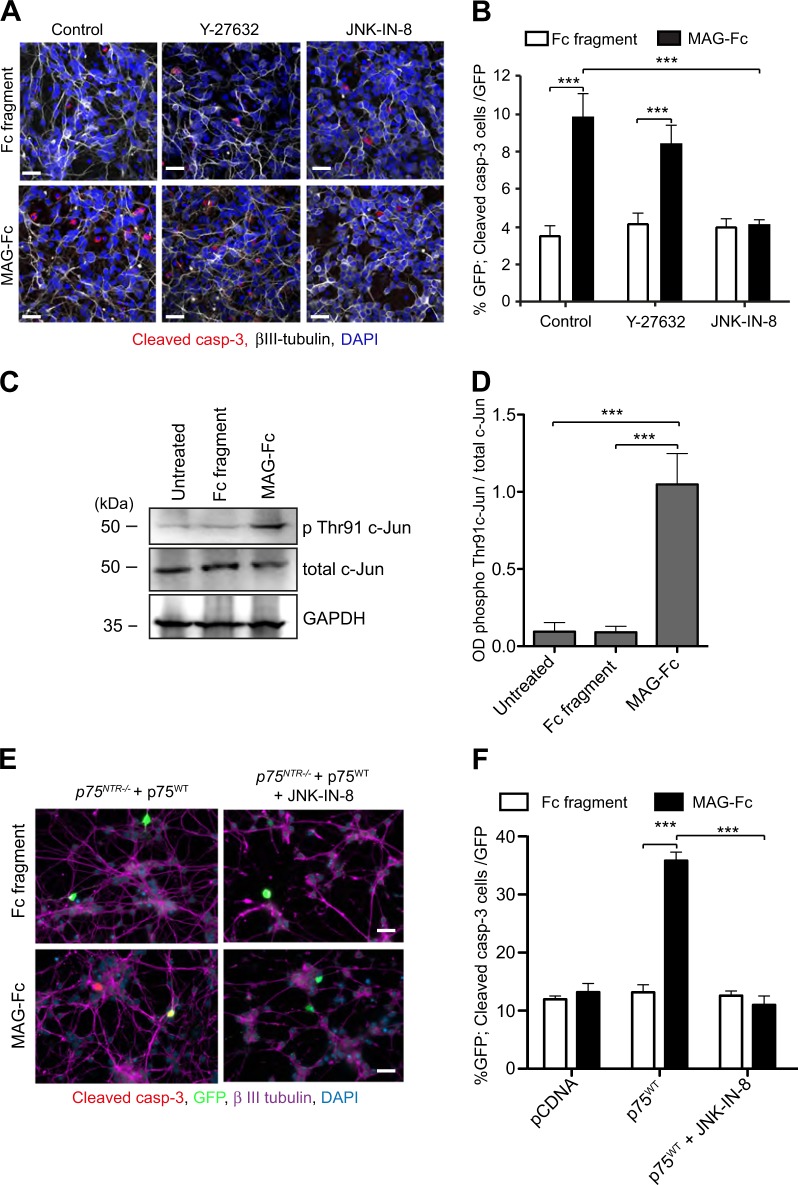
Fig. 7. MAG-mediated CGNs death requires activation of the JNK pathway.
a–b Representative images (a) and quantification of the percentage of cleaved casp-3 positive neurons (b) of P7 wild type CGNs treated on the second day in vitro with either 25 μg/ml Fc fragment alone, 25 μg/ml MAG-Fc alone, Fc fragment plus 10 μM Y-27632, Fc fragment plus 3 μM JNK-IN-8, MAG-Fc plus Y-27632 or MAG-Fc plus JNK-IN-8 for 24 h and triple-labelled with anti-cleaved Casp-3 (red), anti-β III tubulin (grey) and DAPI (blue). Images in A were chosen from 120 images per condition. Scale bars, 20 μm. Graph in B shows mean ± s.e.m. of data from four separate cultures, total of 120 images per condition (***p < 0.001 compared to control, two-way ANOVA followed by Bonferroni post hoc test). c, d Representative (c) and quantification (d) of western blots probed with phospho-c-Jun (Thr91), total c-Jun and GAPDH of lysates from wild type P7 CGNs grown for 24 h prior to 30 min treatment with 25 μg/ml Fc-fragment or 25 μg/ml MAG-Fc. Quantification of c-Jun (Thr91) phosphorylation shown in d represent mean ± sem of densitometry from three experiments (***P < 0.001; one-way ANOVA followed by Bonferroni test). e–f Representative micrographs (e) and quantification (f) of P7 p75NTR−/− CGNs transfected on the second day in vitro with either pcDNA or p75WT constructs and treated 24 h after transfection with either 25 μg/ml Fc fragment alone, 25 μg/ml MAG-Fc alone, Fc fragment plus 3 μM JNK-IN-8 or 25 μg/ml MAG-Fc plus JNK-IN-8 for 24 h. Neurons were quadruple-labelled with anti-cleaved casp-3 (red), anti-GFP (green), anti-MAP2 (magenta) and DAPI (blue). Scale bars, 20 μm. The percentage of cleaved casp-3 positive neurons (f) is shown as mean ± s.e.m. of data from three separate cultures, total of 60 images per genotype and condition (***P < 0.001 compared to control, two-way ANOVA followed by Bonferroni post hoc test)

