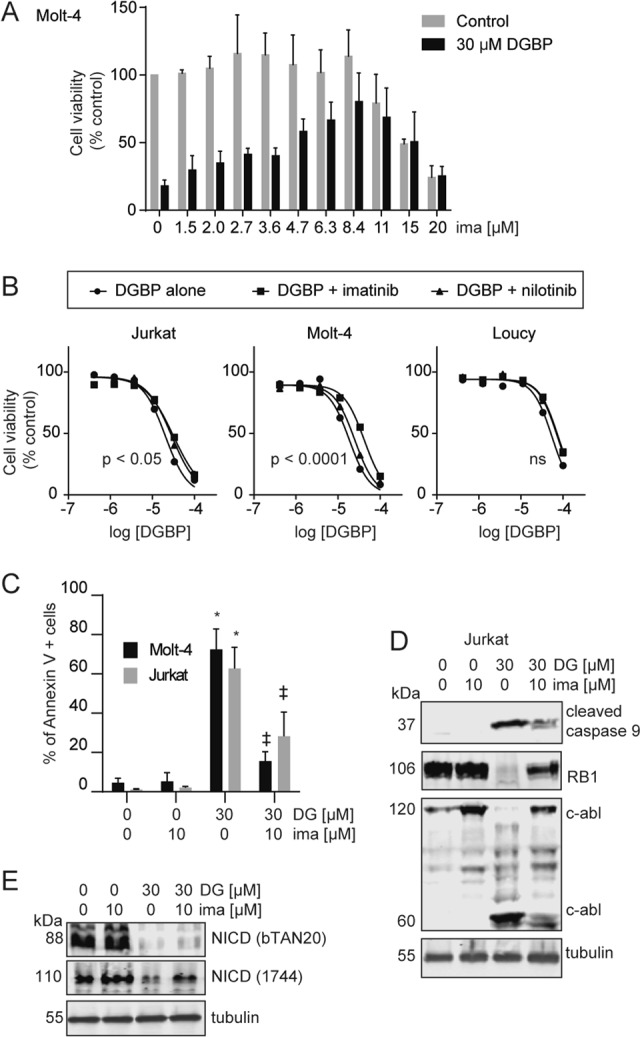
Fig. 4. Inhibitors of c-abl are protective against apoptosis induced by DGBP, downstream of Notch1 and caspases.

a Dose response of Molt-4 cell viability after treatment with or without 30 µM DGBP and the indicated concentrations of imatinib for 72 h. b Dose response of Molt-4, Jurkat, and Loucy cell viability with DGBP in combination with either 10 µM imatinib or 10 µM nilotinib for 72 h. The X axis represents the log of the molar concentration. Curves were generated by nonlinear regression by using a variable slope four-parameter model. The indicated p values represent confidence in whether the IC50 values differed between conditions. c Molt-4 or Jurkat cells were treated with DGBP with or without imatinib for 72 h and assessed by Annexin V staining. Flow plots shown are representative of three independent experiments. The bars represent means and standard deviations of three independent experiments (n = 3). The results were analyzed by using two-way ANOVA with Tukey’s post hoc analysis. *p < 0.05 versus untreated controls. ‡p < 0.05 versus DGBP-treated condition. d Western blotting analysis of cleaved caspase 9, retinoblastoma, and c-abl. Tubulin is shown as a loading control. Jurkat cells were treated for 72 h with DGBP in the presence or absence of imatinib. Western blots are representative of three independent experiments. e Western blot analysis of NICD. Tubulin is shown as a loading control. Jurkat cells were treated for 72 h with DGBP in the presence or absence of imatinib. Western blots are representative of three independent experiments
