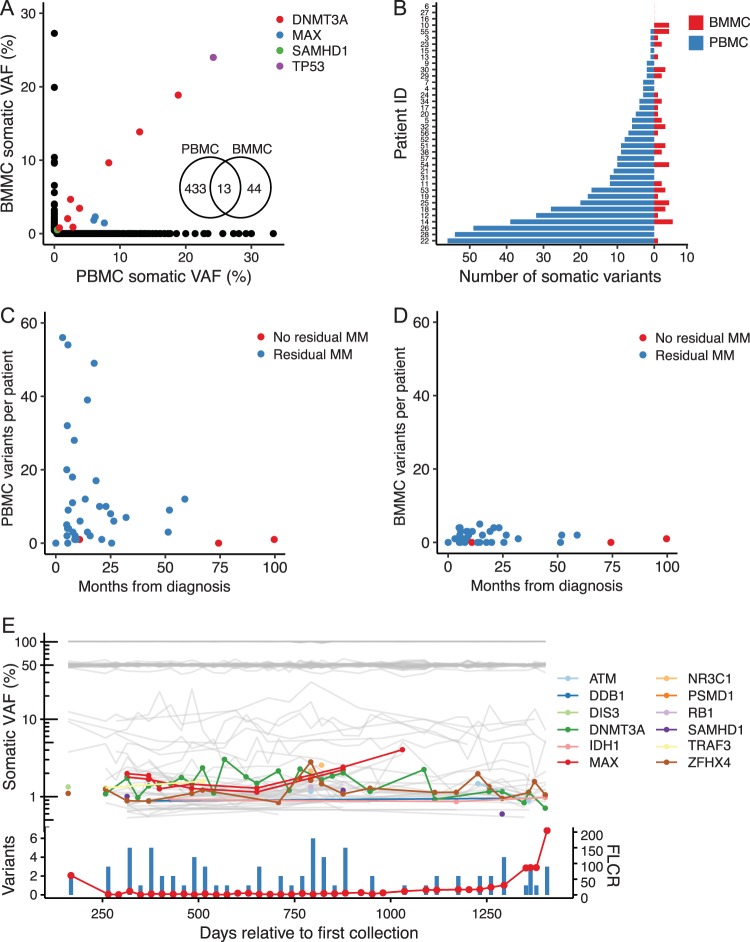
Fig. 1. Somatic mutations detected in unsorted PBMC and BMMC samples from patients with MM.
a Scatter plot of somatic mutation VAF detected in paired PBMC and BMMC samples. b Number of somatic variants detected per patient by tissue type. c Number of somatic variants relative to months from diagnosis in PBMC and d BMMC samples. Indicated in blue are samples with measurable disease, defined by the presence of an abnormal free light chain ratio, elevated M-protein, circulating plasma cells, abnormal bone marrow plasma cells, or bony lesions on X-ray, CT, or MRI. e VAF (top) and total number of coding somatic variants (bottom, blue bars) detected in serially acquired PBMC samples from a single patient with relapsed multiple myeloma collected approximately monthly for 3.8 years. Gray lines in the top panel indicate VAF of germline and non-coding variants. Bottom, red line shows the serum free light chain ratio (FLCR) over the period of time blood was sampled

