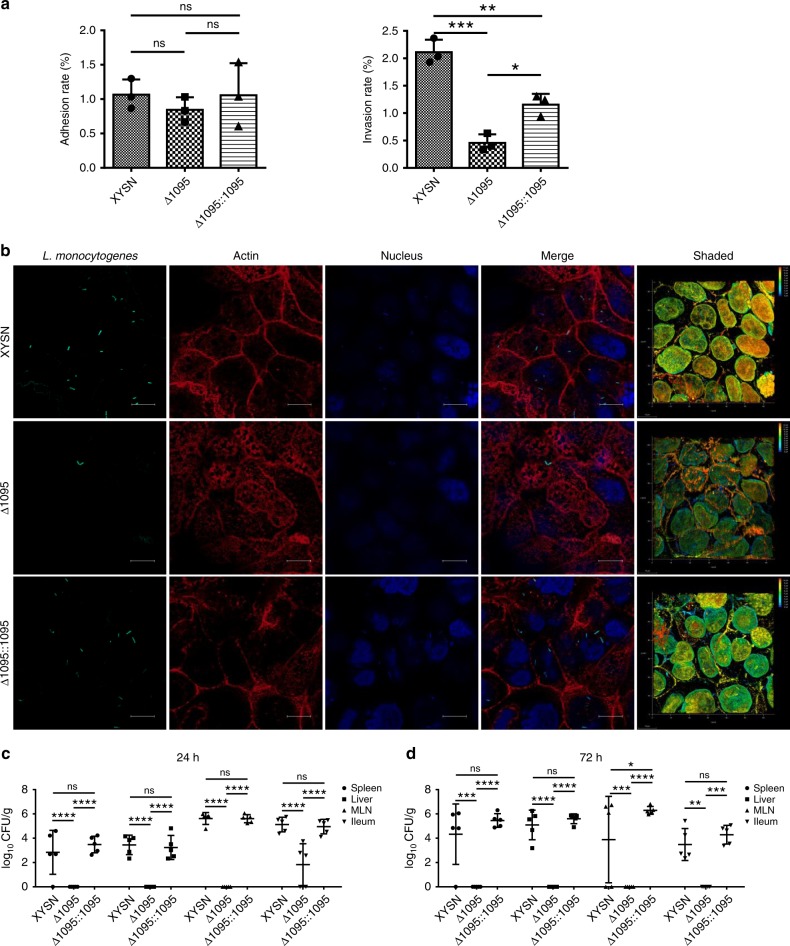
Fig. 4.
Comparative invasive capacities of XYSN and its isogenic WTA mutants. a Adhesion and invasion rates, and (b) confocal images of GFP-expressing strains XYSN, Δ1095, Δ1095::1095 in Caco-2 BBe cells at 15 min post internalization. The actin cytoskeleton was stained by phalloidin (red) and DNA was stained by DAPI (blue) following fixation and permeabilization of the sample. The fluorescent samples were analyzed by confocal microscopy. Magnification of all images: ×1000. Scale bars, 10 μm. Error bars represent SD, n = 3 independent experiments. Statistical analyses were carried out by Tukey's multiple comparisons test: *P < 0.05, **P < 0.01, ***P < 0.001, ns: no significance. c, d Comparative organ colonization properties of XYSN and its isogenic WTA mutants (Δ1095 and Δ1095::1095). Experiments were performed at 24 and 72 h post infection. Each dot represents an organ from one infected mouse. The log CFUs/g represents the mean of five mice per group. Statistical analyses were carried out by Tukey's multiple comparisons test: *P < 0.05, **P < 0.01, ***P < 0.001, ****P < 0.0001, ns: no significance. Error bars represent SD, data represent (c) and (d) two independent experiments

