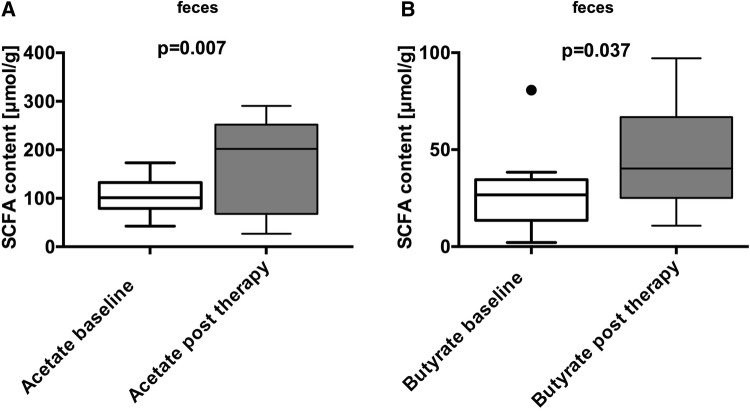
Fig. 4.
Elevated SCFA levels in fecal samples of patients after synbiotic treatment. Fecal samples were analyzed by HPLC. A significant elevation in fecal acetate and butyrate levels (µmol/g) before (white) vs. after synbiotic treatment (grey) were found. Acetate (101 [79–133] vs. 202 [68–252]; p = 0.007) and butyrate content (27 [14–35] vs. 40 [25–67]; p = 0.037) (median [Q1–Q3]; Mann–Whitney U test or t test to compare non-gaussian and gaussian variables. Boxplots according to Tukey)

