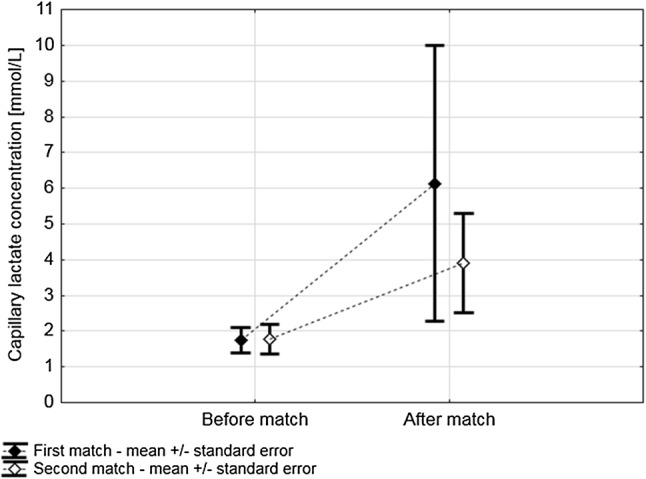
Fig. 2.

Changes in lactate concentrations during the first and second matches. During both matches, players presented similar mean lactate concentrations [Match 1: 4 mmol/l (SE = 0.78) vs. Match 2: 2.8 mmol/l (SE = 0.35), p = 0.23] with a significant rise during play [Match 1: 1.75 (SE = 0.16)–6.13 mmol/l (SE = 1.73); Match 2: 1.77 (SE = 0.18)–3.91 mmol/l (SE = 0.63), p = 0.004]. The rise of lactate was comparable between the events (p = 0.24). SE standard error of the mean
