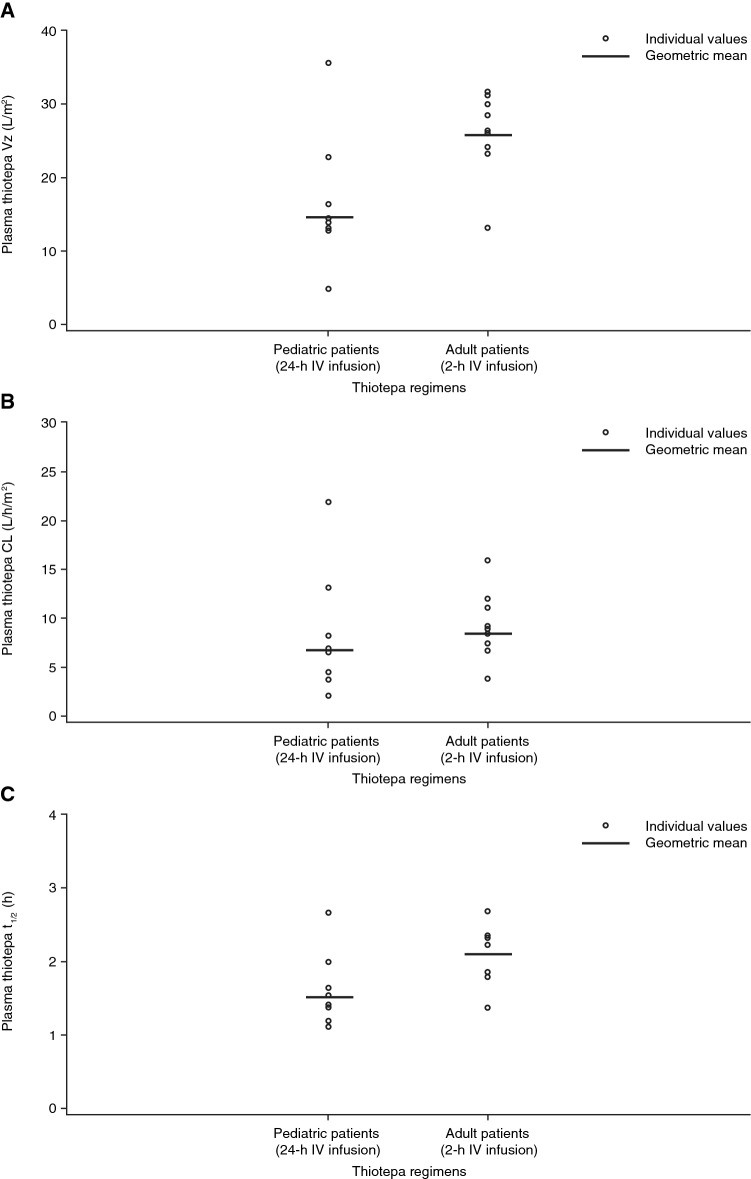
Fig. 2.
Scatterplot of Vz (a), CL (b), and t½ (c) following initial 24-h thiotepa IV infusion in pediatric patients with solid tumors or brain tumors and 2-h thiotepa IV infusion in patients with malignant lymphoma (pharmacokinetic analysis population). CL clearance, IV intravenous, t½ biological half-life, Vz volume of distribution

