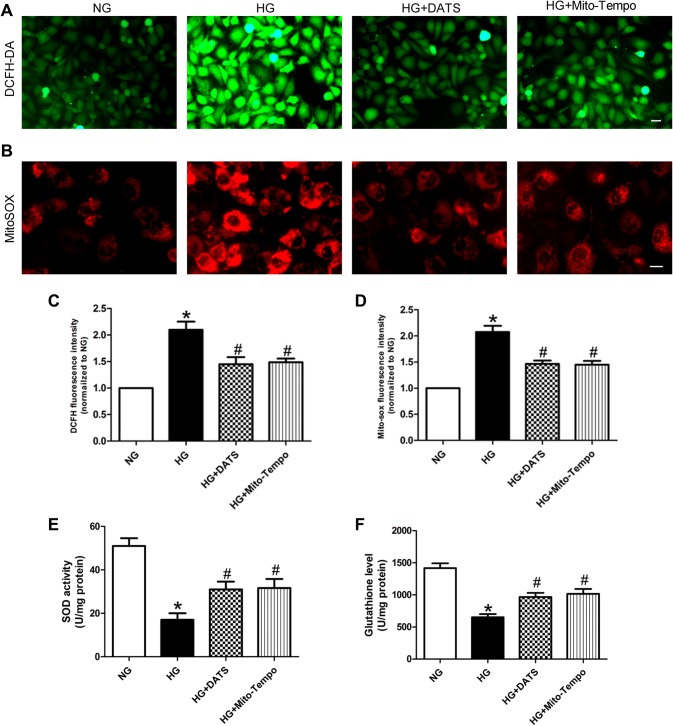
Fig. 2.
Effect of DATS on inhibition of high glucose-induced ROS generation in HUVECs. a, b Intracellular and mitochondrial ROS assay. HUVECs were seeded, treated with different agents, then grown under normal glucose (NG) or high-glucose (HG) conditions, and subjected to the assay. Representative photographs of intracellular ROS (a) and mitochondrial ROS (b). Scale bar = 25 μm. c Quantified data of the intracellular ROS levels. d Quantified data of the mitochondrial ROS levels. e, f SOD and GSH assays. HUVECs were seeded, treated with different agents, then grown under normal glucose (NG) or high-glucose (HG) conditions, and subjected to the assay. The data are represented as mean ± SEM (n = 3). *p < 0.05 versus the NG group and #p < 0.05 versus the HG group

