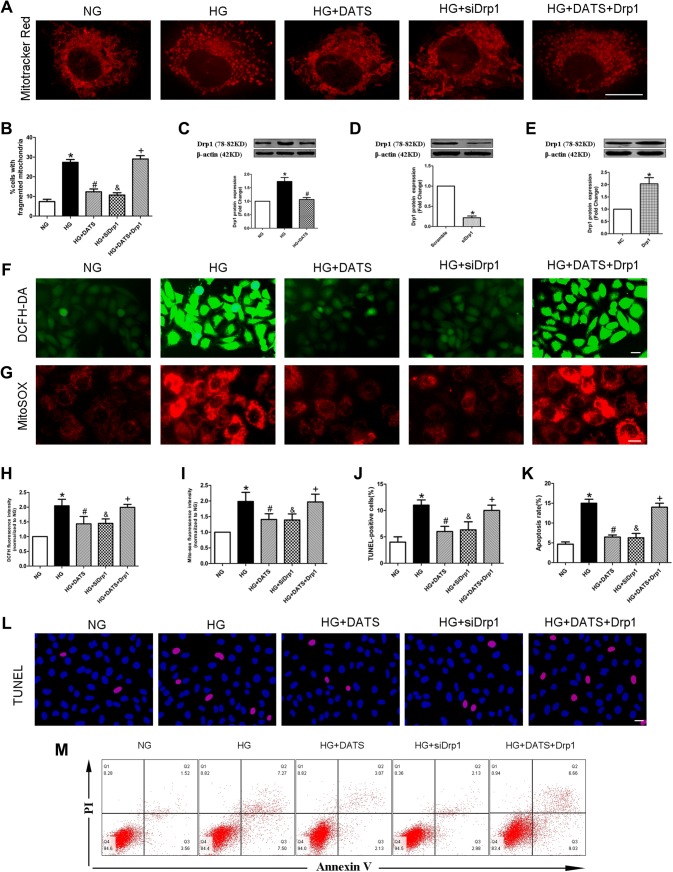
Fig. 4.
Effect of DATS on protection of high glucose-induced HUVEC mitochondrial fission via Drp1 inhibition. a MitoTracker red staining of the mitochondrial morphology. HUVECs were seeded, treated with different agents, and subjected to the assay. Scale bar = 25 μm. b Quantified data described in (a). c–e Western blot. HUVECs were seeded, treated with different agents, and subjected to western blot analysis of Drp1 protein. f–g The intracellular and mitochondrial ROS assay. h–i Quantified data described in (f) and (g). i–k Quantified data described in (l) and (m). l–m TUNEL assay and flow cytometry. Representative photographs of DAPI (blue) and TUNEL (pink) staining; scale bar = 25 μm. The data are expressed as mean ± SEM (n = 3). *p < 0.05 versus the NG group, #p < 0.05 versus the HG group, &p < 0.05 versus the HG group, and +p < 0.05 versus the HG plus DATS group

