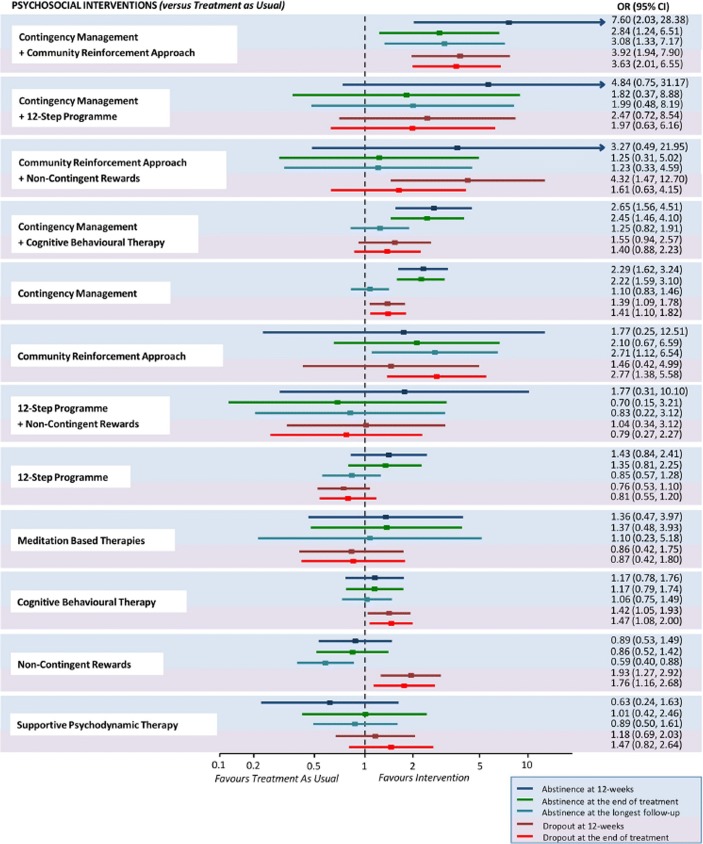
Fig. 1.
Abstinence and dropout at different time points for each psychosocial intervention versus treatment as usual. Estimates are reported as ORs, where an OR above 1 favors the psychosocial intervention indicated on the left side over treatment as usual. For each intervention, efficacy outcomes are reported in the blue-shaded area, whereas acceptability outcomes are reported in the pink-shaded area. OR = odds ratio. (Reprinted from De Crescenzo et al., 2018)

