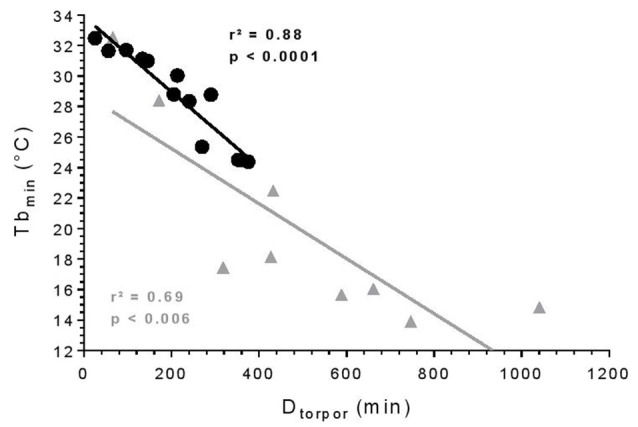
Figure 1.

Torpor features. Relationship between minimum body temperature (Tbmin) and duration of torpor bouts (Dtorpor). Each symbol represents an episode of torpor (25°C: black circle; 10°C: gray triangle). The straight line depicts the linear regression line. R- and p-values: Pearson’s correlation (25°C: n = 4, number of events = 13; 10°C: n = 2, number of events = 9).
