
FIGURE 3.
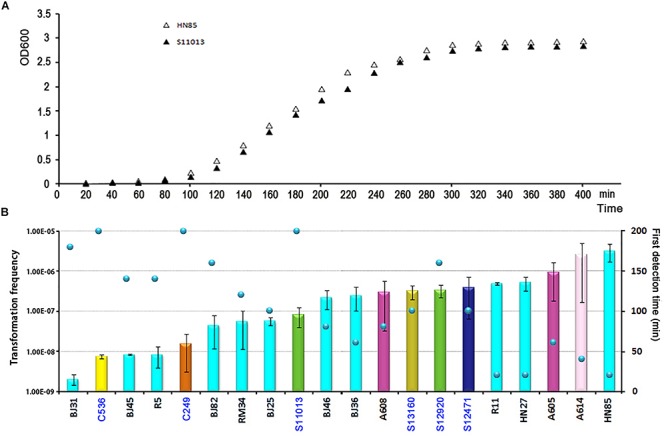
The competence induction time of A. baumannii isolates with different transformation frequencies. (A) Growth curve of the MDR A. baumannii isolate HN85 and the sensitive isolate S12920 in LB-no salt and LB, respectively. (B) The competence induction time of 20 A. baumannii isolates. The bar chart shows the transformation frequency, the color of the bar indicate the STs of the isolates, as shown in Figure 2. The sensitive strains were marked by blue fonts. The scatter plot shows the time point at which transformant colonies were first obtained.