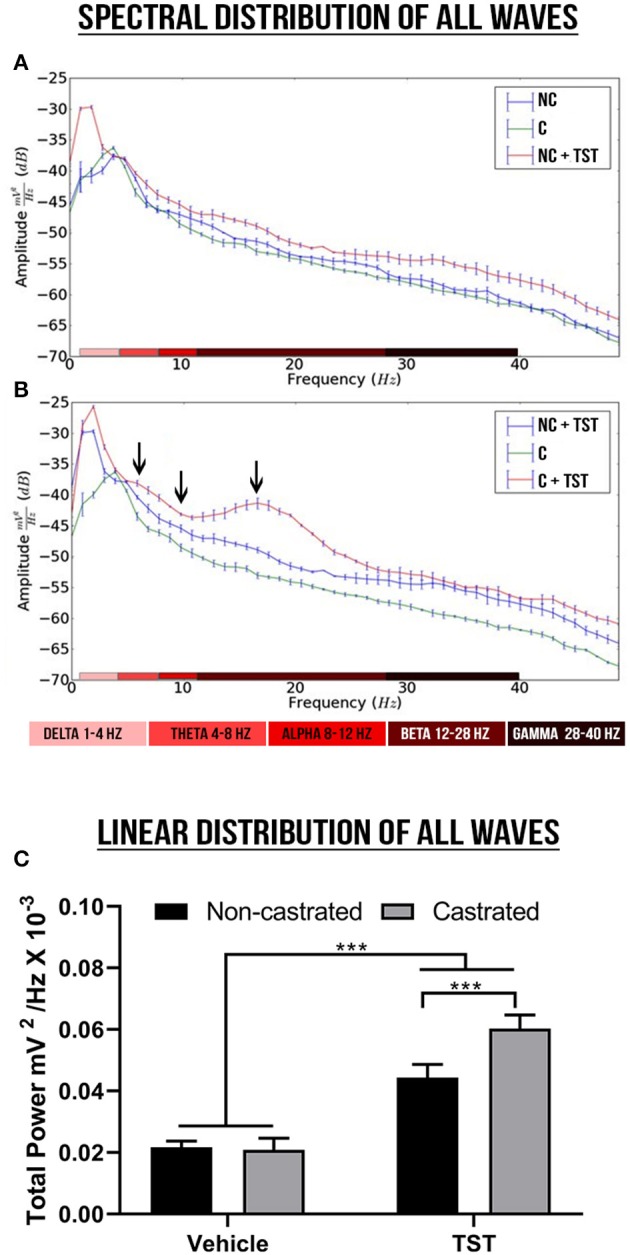
Figure 3.

Spectral power and linear frequency distributions of intact and castrated animals with/without testosterone supplementation. (A,B) Represent the spectral power distributions of the delta, theta, alpha, beta, and gamma cerebral waves between groups, while the arrows indicate the oscillations. (C) Represents the linear frequency distribution between groups of power up to 40 Hz. The data are expressed as means ±SD (n = 9 animals/group; ***p < 0.001). (NC, non-castrated; C, castrated; NC + TST, non-castrated + testosterone; C + TST, castrated + testosterone).
