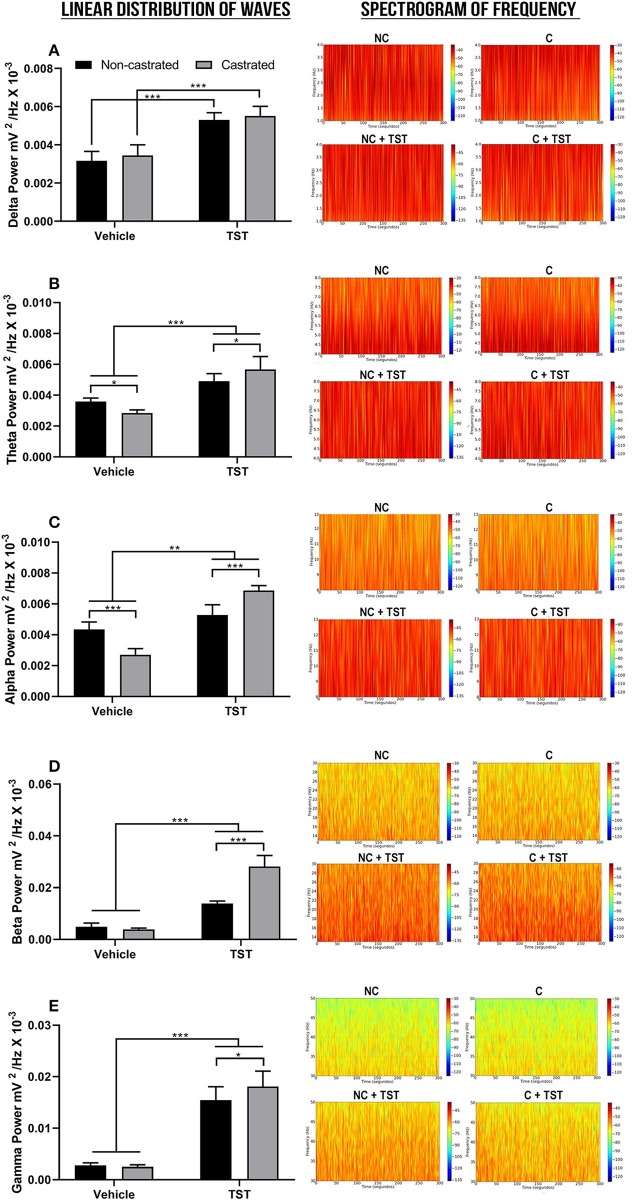
Figure 4.
Decomposition of the cerebral waves. (A) Linear frequency distribution (left) and spectrogram of the frequencies (right) of the delta waves. (B) Linear frequency distribution (left) and spectrogram of the frequencies (right) of theta waves. (C) Linear frequency distribution (left) and spectrogram of the frequencies (right) of the alpha waves. (D) Linear frequency distribution (left) and spectrogram of the frequencies (right) of the beta waves. (E) Linear frequency distribution (left) and spectrogram of the frequencies (right) of the gamma waves. The data are expressed as means ±SD. (n = 9 animals/group; *p < 0.05, **p < 0.01, and ***p < 0.001). (TST, testosterone; NC, non-castrated; C, castrated; NC + TST, non-castrated + testosterone; C + TST, castrated + testosterone).

