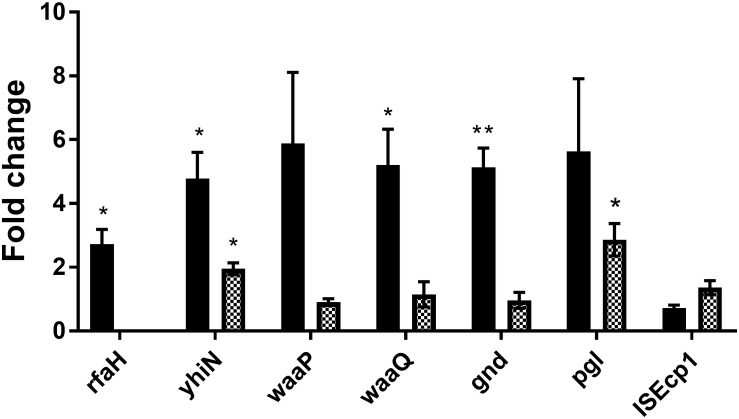
FIGURE 5.
CTX induces expression of six genes involved in antibiotic induced traF expression in MG1655/pTF2. MG1655/pTF2 (Black bars) and the ΔrfaH (squared bars) were grown with 1/2 MIC CTX or without. Data are presented as fold change in CTX induced expression relative to expression levels without CTX. Three independent replicates including two technical replicates each were performed. The data shown represents the mean and the error bars represent standard deviations. The expression data was normalized to gapA and nusG. The stars indicate statistical significance at different levels: ∗P ≤ 0.05, ∗∗P ≤ 0.01.

