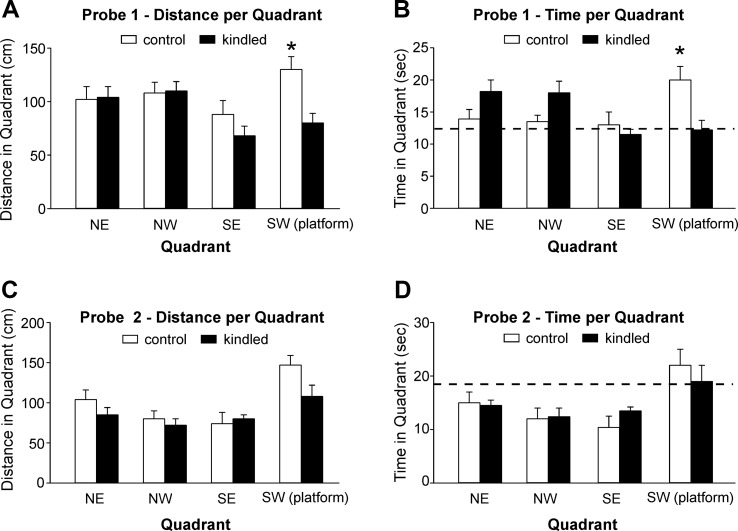
Figure 3.
Measures for probe tests. Data (means ± SEM) were collected from the extended kindled and handling control mice (n = 12 each group). (A, B) Distances traveled and time spent in each of the quadrants during the first probe trial. (C, D) The same measures collected during the second probe trial. Dotted lines represent chance performance. Note that the kindled mice traveled shorter distances and spent less time in the correct quadrant as compared to the controls. Significant differences between the control and extended kindled mice were denoted by *.

