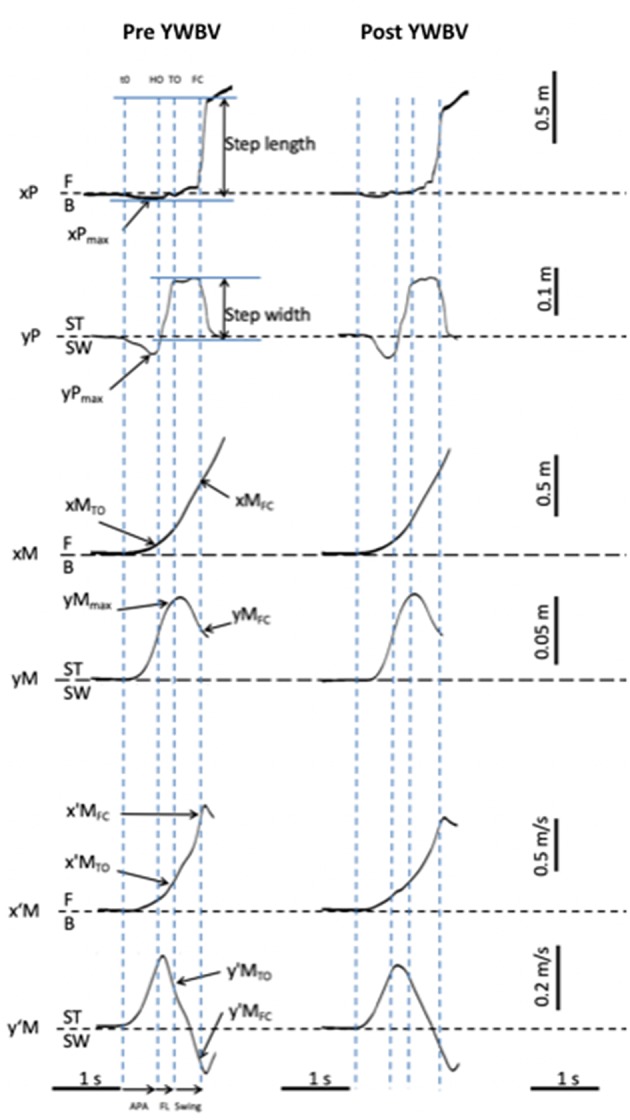
Figure 1.

Typical biomechanical traces and representation of the main experimental variables obtained in one young adult of the WBV group initiating gait in the pre and post treatment condition. Anteroposterior (AP) direction (x axis): x′M: center of mass (COM) velocity; x′MTO and x′MFC: COM velocity at toe off and foot contact. xM: COM displacement; xMTO and xMFC: COM displacement at toe off and foot contact; xP: center of pressure (COP) displacement; xPmax: peak of COP displacement during the anticipatory postural adjustments; F: forward; B: backward. Mediolateral (ML) direction (x axis): y′M: COM velocity; y′MTO and y′MFC: COM velocity at toe off and foot contact; yM: COM displacement; yMTO and yMFC: COM displacement at toe off and foot contact; yP: COP displacement; yPmax: peak of COP displacement during the APA; ST: stance limb; SW: swing limb. Vertical dashed lines t0: onset variation of biomechanical traces; HO: swing heel off; TO: swing toe off; FC: swing foot contact. Horizontal arrows: APA: anticipatory postural adjustments phase; FL: foot lift phase; swing: execution phase.
