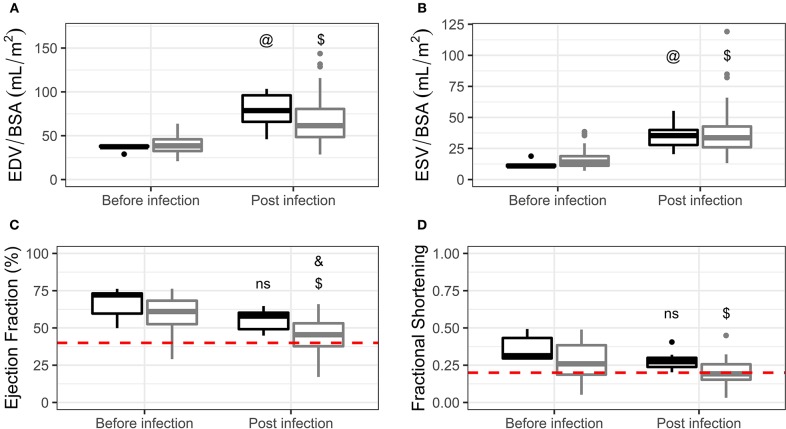
Figure 1.
Volumes indexed by body surface area (A,B) and systolic function (C,D) comparisons in non-infected controls (black) and infected dogs (gray) before and post infection. Data are represented using Tukey's boxplots. @p < 0.05 compared to non-infected controls in the “before infection” time point. $p < 0.05 compared to infected dogs in the “before infection” time point. &p < 0.05 compared to non-infected controls in the “post infection” time point. ns, not significant compared to non-infected controls in the “before infection” time point. Red dashed lines represent proposed inclusion criteria cut-offs (see “Establishment of inclusion criteria” in the main text).

