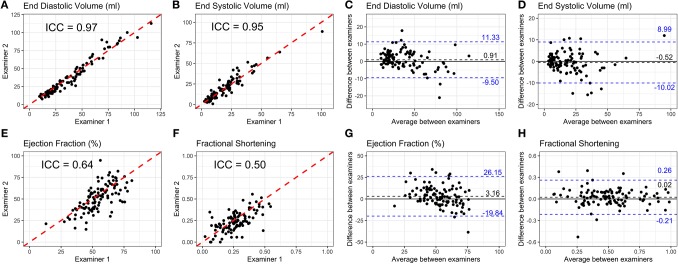
Figure 3.
(A,B,E,F) Scatterplots and intraclass correlation coefficients (ICC) for left ventricular end diastolic volume, end systolic volume, ejection fraction, and fractional shortening, calculated from the measurements obtained by 2 independent blinded examiners. The proximity of a data point to the dashed red line indicates a high degree of agreement between the measures of both examiners. (C,D,G,H) Bland-Altman plots showing differences between examiners on the Y axis and averaged values for both examiners on the X axis for each measurement. The dashed black line indicates the mean difference between examiners considering all measurements and the dashed blue lines represent 95% limits of agreement between examiners.

