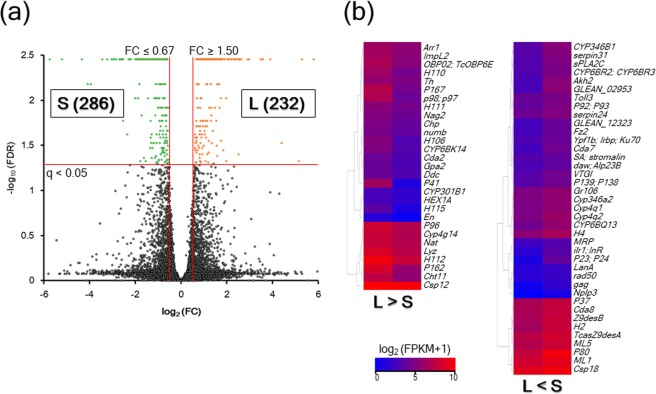
Figure 1.
Volcano plot (a) and heatmap (b) for comparisons between the L and S strains. (a) Volcano plot showing log2 FC (x-axis) and log10 FDR corrected P-value (y-axis) points of all the expressed genes in the Tcas5.2 reference genome using Microsoft Office Excel. The orange dots represent 232 DEGs of the L strain (FC ≥ 1.5 and q < 0.05), whereas the green dots represent 286 DEGs of the S strain (FC ≤ 0.67 and q < 0.05). (b) A heatmap showing 68 DEGs with defined locus names was created using the R package “gplots”. The color gradient represents high-expression (red) to low-expression (blue) by calculating log2 (FPKM + 1).

