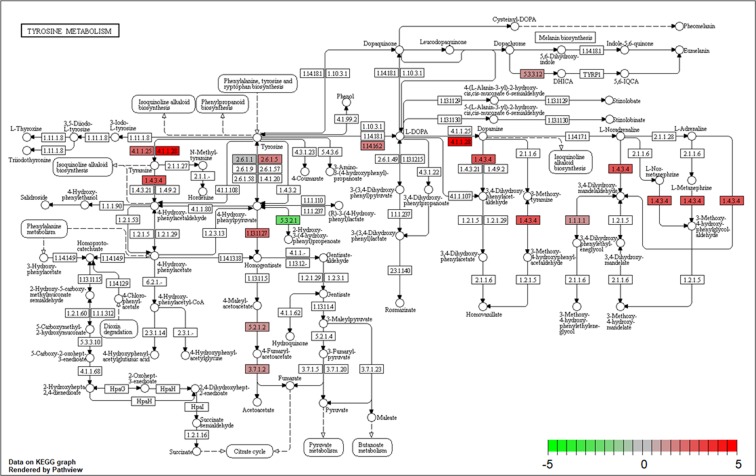
Figure 2.
KEGG pathway for tyrosine metabolism in T. castaneum (tca00350). The color gradient represents differences in the intensity of FC between the L and S strains. The FC was calculated as (FPKM of the L strain + 0.1)/(FPKM of the S strain + 0.1) when the expression value of the L strain was higher than that of the S strain. In contrast, FC was calculated as (FPKM of the S strain + 0.1)/(FPKM of the L strain + 0.1) × (−1) when the expression value of the L strain was lower than that of the S strain.

